

What's changed: Initial version
1.3Balanced scorecard and strategic goal management
Covers the balanced scorecard (BSC) and strategy map that concretize strategy through four perspectives—financial, customer, internal business process, and learning and growth—and the relationship and causal chain among the final goal KGI, the critical success factor CSF, and the interim indicator KPI, as the judgment skill of "correctly translating goals into indicators and spotting a mis-set KPI."
Even an excellent strategy ends as a pie in the sky unless it is translated into concrete indicators the frontline tracks daily. The balanced scorecard (BSC) is a management method that avoids short-term bias from measuring strategy by financial indicators alone, translating strategy into goals and indicators in a balanced way across four perspectives—financial, customer, internal business process, and learning and growth. When linking business goals to information-system measures, an IT strategist uses these four perspectives and the causal chain of KGI (final goal), CSF (critical success factor), and KPI (interim indicator) to verify "whether the measure truly leads to achieving the business goal." This section develops not the rote memorization of terms, but the judgment to translate goals into correct indicators and to spot a KPI whose causality is misaligned.
1.3.1The BSC's four perspectives and the strategy map
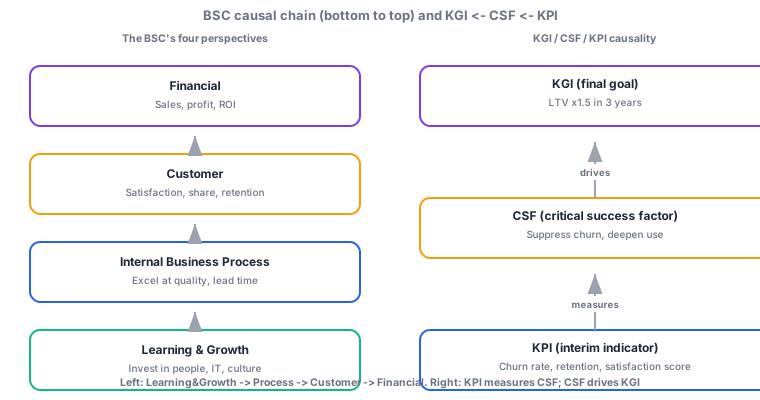
- The BSC's four perspectives: financial (the shareholder/earnings view—sales, profit, ROI, etc.), customer (how the firm wants to be seen by customers—satisfaction, share, retention, etc.), internal business process (which processes to excel at to deliver superior results—quality, lead time, etc.), and learning and growth (the base to keep adapting to change—people development, IT, organizational culture, etc.).
- The strategy map is a diagram connecting the four perspectives' goals with cause-and-effect arrows, where lower perspectives support higher ones. The basic chain is learning and growth -> internal business process -> customer -> financial: investment in people and IT improves business processes, which raises customer value, ultimately bearing fruit in financial results—visualizing this "cause -> effect" flow.
1.3.2The KGI-CSF-KPI causal chain
- KGI (Key Goal Indicator) is the final outcome goal the strategy aims at (e.g., operating margin of X%, customer lifetime value of Y yen). CSF (Critical Success Factor) is the decisively important factor for achieving that KGI (e.g., improving customer satisfaction, improving repeat rate). KPI (Key Performance Indicator) is the interim, leading indicator measuring the degree of CSF achievement (e.g., satisfaction-survey score, churn rate, repeat-purchase rate).
- The three connect by causality: KGI <- CSF <- KPI. Starting from the KGI, identify "which CSFs are needed to achieve it," then design "which KPIs measure the CSFs' progress." A KPI must connect directly to CSF achievement and ultimately to the KGI. Setting a KPI whose causality does not connect (an indicator measuring only a measure's output volume or input cost, etc.) causes "indicator spinning"—hitting the KPI without getting closer to the strategic goal.
Most-tested: the BSC's four perspectives are financial / customer / internal business process / learning and growth; the strategy-map causality is learning and growth -> internal process -> customer -> financial; and KGI is the final goal, CSF the critical success factor, KPI the interim indicator measuring CSF achievement. Practice being able to verify that the KGI -> CSF -> KPI causality connects and to spot a mis-set KPI.
As an IT strategist, you are supporting the work of translating a subscription-service company's medium-term strategy into indicators. The business goal (KGI) is "increase customer lifetime value (LTV) 1.5x in three years." You first identify the decisive factor (CSF) for achieving this final goal—since LTV is determined by "retention period per customer x revenue during the period," the CSF here is suppressing churn (customer retention) and deepening continued use. Next, you design a KPI to measure the degree of CSF achievement. Valid KPIs are leading indicators that connect directly to the CSF's progress (customer retention) and ultimately to the KGI (LTV improvement)—such as monthly churn rate, continued-use rate, and customer-satisfaction-survey score. But suppose the frontline proposes "let us make the development team's number of new-feature releases the KPI." It seems plausible at a glance, but a causal misalignment lurks here. How many new features were shipped (a measure's output volume) does not itself guarantee improved retention or satisfaction, and is not an indicator measuring the degree of CSF achievement. If churn does not fall even as features increase, LTV will not grow, falling into "spinning"—hitting only the KPI while drifting from the strategic goal. The judgment an IT strategist should make is to verify by tracing the causality backward—"Does that KPI measure CSF achievement? Does that CSF connect directly to KGI achievement?"—and to replace a "sense-of-effort" indicator measuring output volume or input cost with an indicator closer to the outcome, namely a change in customer behavior (churn rate, continued-use rate). If the release count must still be watched, position it not as a KPI but as a work indicator for managing the measure's execution status, distinguished from the strategy's KPI.
| Indicator | Meaning | Example (LTV-improvement strategy) |
|---|---|---|
| KGI (Key Goal Indicator) | The final outcome goal the strategy aims at | Increase customer lifetime value (LTV) 1.5x in three years |
| CSF (Critical Success Factor) | The decisively important factor for KGI achievement | Suppressing churn, deepening continued use |
| KPI (Key Performance Indicator) | An interim, leading indicator of CSF achievement | Monthly churn rate, continued-use rate, satisfaction score |
Trap: "A KPI just needs to measure a measure's execution volume, so use the number of new-feature releases or total ad spend as the KPI" is wrong—a KPI must be an indicator measuring CSF achievement and close to the outcome that ultimately connects to the KGI; a mere output volume or input cost invites "spinning" that hits the KPI without approaching the strategic goal. Also wrong: "the BSC is a method that centers on financial indicators"—the BSC avoids financial bias and balances across four perspectives including customer, internal process, and learning and growth. The causality does not start from financial; its direction is learning and growth -> internal process -> customer -> financial.
1.3.3Section summary
- The BSC turns strategy into balanced indicators across four perspectives—financial, customer, internal business process, and learning and growth—avoiding financial bias
- The strategy map's causality runs learning and growth -> internal process -> customer -> financial, with lower perspectives supporting higher ones
- Verify the causality KGI (final goal) <- CSF (critical success factor) <- KPI (interim indicator), spot an "output-volume" KPI that does not measure CSF achievement, and replace it with an outcome-closer indicator
Sign in to track progress — Log in.
Quick check
(just a quick review)Q1. A subscription company set its KGI as "increase customer lifetime value (LTV) 1.5x in three years" and its CSF as "suppressing churn and deepening continued use." Which is the most appropriate KPI to measure the degree of this CSF's achievement?
Q2. In a balanced scorecard's strategy map, the four perspectives are linked by cause and effect. Which is the most appropriate direction of the causal chain from cause to effect?
Q3. Which best explains the relationship among KGI, CSF, and KPI that an IT strategist uses when translating business goals into information-system measures?
Keep track of your progress
The full study guide is free to read. Sign up free to practice with the question bank, track what you have read, review your mistakes, and highlight passages.