

What's changed: In-scope service coverage (axis B): added Athena/OpenSearch Service large-scale log-analysis definitions, roles, and selection criteria to s1 (CloudWatch).
5.1Observability with CloudWatch
Understand observability basics: CloudWatch Logs / Logs Insights, metrics and alarms, and custom metrics. The starting point for "Troubleshooting and Optimization" in DVA-C02.
To find and fix problems fast, you must see your app’s logs, metrics, and traces. The AWS core is Amazon CloudWatch.
5.1.1Logs, metrics, and traces
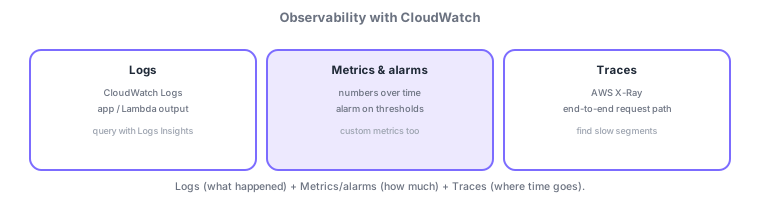
- Logs: CloudWatch Logs aggregates app/Lambda output; query/analyze with Logs Insights.
- Metrics/alarms: collect numeric time-series and alarm on threshold breaches (notify, autoscale).
- Custom metrics: send app-specific metrics (e.g., order count) to monitor.
Common on DVA: aggregate/query logs = CloudWatch Logs / Logs Insights, notify/auto-respond on thresholds = CloudWatch alarms, app-specific = custom metrics. Lambda logs go to CloudWatch Logs automatically.
Observability rests on three pillars: logs, metrics, traces. CloudWatch Logs aggregates logs into log groups / log streams with configurable retention (set it appropriately—indefinite retention raises cost). Logs Insights interactively aggregates and filters large volumes with a dedicated query language. Metrics are numeric time-series: alongside standard metrics like CPU usage, you can send app-specific custom metrics (e.g., order count) via PutMetricData. An alarm fires when a metric stays past a threshold for a period, triggering SNS notifications, Auto Scaling, or automated actions; composite alarms handle combined conditions. Dashboards show these on one screen, and subscription filters (forwarding to Lambda/Kinesis) process logs in real time—both common in practice.
| What you want | Use |
|---|---|
| What happened (events/errors) | CloudWatch Logs / Logs Insights |
| How much (numeric trend) | Metrics |
| Notify/auto-respond on breach | Alarm (→ SNS/Auto Scaling) |
| Where time went | X-Ray traces |
Scenario: catch a spike in Lambda errors. Lambda logs flow to CloudWatch Logs automatically, so use a metric filter to turn "ERROR" lines into a numeric metric, then an alarm to notify via SNS on breach. Investigate with Logs Insights, filtering the relevant time window and tracing per request via a correlation ID.
Q. Where are Lambda logs? Automatically in CloudWatch Logs. Q. Monitor a custom metric? Custom metrics (PutMetricData). Q. Auto-respond on a threshold? Alarm → SNS/Auto Scaling. Q. Analyze large logs? Logs Insights.
Watch the mix-ups: (1) Logs = "what happened," metrics = "numeric trend," traces = "where time went"—don’t swap roles. (2) Indefinite log retention inflates cost. (3) Metrics not in the standard set must be sent as custom metrics.
5.1.2Analyzing logs at scale (Athena, OpenSearch Service)
CloudWatch Logs Insights is handy, but when you want to analyze large volumes of logs or access logs aggregated in S3 with ad-hoc SQL, or visualize with full-text search and rich dashboards, other options appear. Amazon Athena is a serverless query service that queries data in S3 directly with standard SQL—no pre-loading, and billed by the amount of data scanned. It suits aggregating CloudTrail logs, ALB/CloudFront access logs, or exported app logs with SQL only when needed. Amazon OpenSearch Service is a full-text search and log-analytics platform: ingest and index logs, then interactively search, visualize, and alert via OpenSearch Dashboards. Rule of thumb: ad-hoc SQL over S3 data on demand = Athena; full-text search or continuous log-visualization dashboards = OpenSearch Service; immediate queries over operational logs = CloudWatch Logs Insights.
| What you want | Choice |
|---|---|
| Ad-hoc SQL over logs in S3 | Amazon Athena |
| Full-text search and dashboards | Amazon OpenSearch Service |
| Query operational logs immediately | CloudWatch Logs Insights |
5.1.3Section summary
- Logs (Logs/Insights) / metrics & alarms / custom metrics
- Lambda logs flow automatically to CloudWatch Logs
Sign in to track progress — Log in.
Quick check
(just a quick review)Q1. Where do a Lambda function’s logs go by default?
Q2. You want to notify or autoscale when a metric crosses a threshold. What do you use?
Q3. Which CloudWatch feature interactively queries/analyzes aggregated logs?
Keep track of your progress
The full study guide is free to read. Sign up free to practice with the question bank, track what you have read, review your mistakes, and highlight passages.