

What's changed: In-scope service coverage (axis B): added Athena/OpenSearch Service large-scale log-analysis definitions, roles, and selection criteria to s1 (CloudWatch).
5.2Distributed Tracing and Debugging with X-Ray
Understand debugging with AWS X-Ray: distributed tracing (request path and per-segment latency), pinpointing bottlenecks/errors, and the service map.
In multi-service flows, it gets hard to see where it’s slow or failing. AWS X-Ray traces requests and visualizes per-segment latency and errors.
5.2.1Traces and the service map
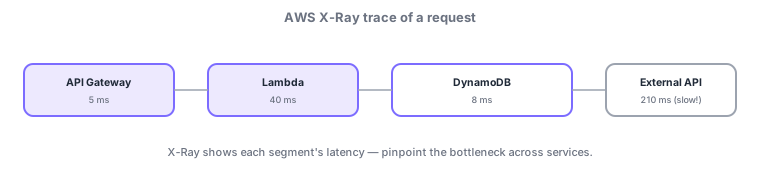
- Trace: records the segments and latency of each service a single request passes through.
- Service map: visualizes dependencies and health between services.
- Identify slow or error-prone segments to isolate bottlenecks.
Master X-Ray’s structure. A whole request is a trace, each service’s processing span is a segment, and fine-grained work inside it (e.g., a DB call) is a subsegment. Recording every request is heavy, so sampling captures a subset, balancing cost and coverage. Annotations are indexed and filterable; metadata is extra info not searchable. Lambda and API Gateway can enable active tracing via configuration; on EC2/ECS the X-Ray daemon (or a sidecar) sends traces. Instrument the app with the SDK to measure external calls. To stitch traces across services, the trace header (X-Amzn-Trace-Id) must propagate. The visual service map makes nodes with high error rates or latency obvious at a glance.
| Term | Meaning |
|---|---|
| Trace | Record of one whole request |
| Segment | A service’s processing span |
| Subsegment | Fine-grained work (e.g., DB call) |
| Sampling | Record a subset to control cost |
Scenario: an API is intermittently slow. Enable active tracing on Lambda and API Gateway, and use the X-Ray service map to spot the high-latency node. Opening a trace shows the external-API subsegment dominating at 210 ms—so the bottleneck is the external dependency. Adding a user ID as an annotation lets you filter to just that user’s slow requests.
Q. Where is it slow? X-Ray distributed tracing. Q. Record everything? No—sample a subset. Q. Values to filter on? Annotations (indexed). Q. Vs. logs? Logs = what happened; X-Ray = where time went (complementary).
Watch the mix-ups: (1) X-Ray shows "where time went," logs show "what happened"—complementary, not a replacement. (2) Put filterable values in annotations (metadata isn’t searchable). (3) Cross-service tracing requires propagating the trace header.
5.2.2Section summary
- X-Ray = distributed tracing visualizing per-segment latency/errors
- Use the service map to see dependencies/health and isolate bottlenecks
Sign in to track progress — Log in.
Quick check
(just a quick review)Q1. You want to pinpoint which segment of a multi-service request is slow. Which service fits best?
Q2. Which X-Ray feature shows dependencies and health between services as a diagram?
Q3. Which correctly describes logs (what happened) vs. traces (where time went)?
Keep track of your progress
The full study guide is free to read. Sign up free to practice with the question bank, track what you have read, review your mistakes, and highlight passages.