

What's changed: In-scope coverage (fix): added a Trusted Advisor best-practice-checks block to §4.3 (closes an Axis-B textbook gap)
4.3Tracing and Unified Observability
Understand unified observability—X-Ray (distributed tracing), ServiceLens, Synthetics (canaries), Container/Lambda Insights, and CloudTrail. Correlate metrics, logs, and traces to find causes fast.
Unifying the three pillars—metrics, logs, traces—speeds root-cause analysis. X-Ray and CloudWatch enable this.
4.3.1Unified observability
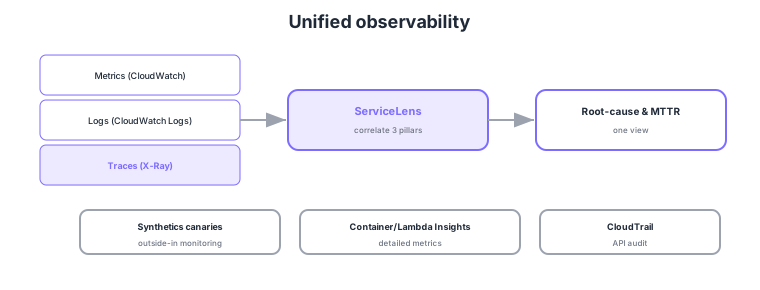
- X-Ray: distributed tracing to visualize cross-service latency/errors and find bottlenecks.
- ServiceLens: correlates metrics/logs/traces in one view.
- Synthetics: canaries for outside-in monitoring, continuously testing endpoints as a user.
- Container/Lambda Insights: collect detailed metrics for containers/serverless. CloudTrail audits APIs.
Common on DOP-C02: distributed tracing = X-Ray, correlate 3 pillars = ServiceLens, user-perspective outside-in = Synthetics canaries, container/Lambda detailed metrics = Container/Lambda Insights, API auditing = CloudTrail. Unify metrics/logs/traces to cut MTTR.
Unified observability aims to cut MTTR by moving between metrics, logs, and traces during incidents. X-Ray propagates a trace header (trace ID) to draw a service map showing per-segment/subsegment timing and errors. Instrument apps with the SDK or the vendor-neutral OpenTelemetry (AWS Distro for OpenTelemetry, ADOT), controlling volume via sampling rules. ServiceLens correlates traces with CloudWatch metrics/logs to trace causes in one view. Synthetics runs canaries that test endpoints from outside on a schedule, detecting degradation even with no real-user traffic (outside-in), while RUM (Real User Monitoring) complements with actual users’ browser experience (inside-out). Container Insights/Lambda Insights collect detailed metrics for ECS/EKS and serverless (cold starts, memory, throttles, etc.). CloudTrail audits "who called which API and when," and combined with EventBridge can detect and auto-respond to suspicious actions. These deliver their real value used in correlation via dashboards and alarms rather than in isolation, powering the DevOps operational feedback loop (observe → improve).
| What you want to know | Service | Perspective |
|---|---|---|
| Where is it slow across services | X-Ray | Distributed tracing; service map |
| Correlate 3 pillars for root cause | ServiceLens | Metrics/logs/traces in one view |
| Is it down from a user’s view | Synthetics / RUM | Outside-in / real-user inside |
| Who operated the API | CloudTrail | API audit; EventBridge integration |
Scenario: A user reports "checkout is slow," but you don’t know if it’s web, API, DB, or an external dependency. → Identify the slow segment (e.g., an external payment API call) on the X-Ray service map, then use ServiceLens to correlate the relevant Lambda’s logs/metrics at that time to confirm root cause. For recurrence detection, run a Synthetics canary of the checkout flow every minute, wiring threshold breaches to SNS notification + automated response.
FAQ: Synthetics vs RUM? Synthetics is synthetic monitoring (canaries)—scripts test endpoints periodically even with no real users (outside-in; good for SLA monitoring). RUM is real-user browser instrumentation, collecting actual perceived performance and errors (inside-out). They are complementary: Synthetics excels at availability, RUM at real experience.
Exam trap: Choosing CloudTrail to "find the cross-service latency bottleneck" is wrong. CloudTrail is API-operation auditing; visualizing request paths and latency is X-Ray’s job. And "correlate metrics/logs/traces in one view" is ServiceLens—don’t mismatch service names to roles.
4.3.2Managed open-source observability (Grafana / Prometheus)
Beyond CloudWatch-native tooling, you can run an open-source observability stack as a managed service. Amazon Managed Service for Prometheus (AMP) is Prometheus-compatible metrics ingestion/storage—query container-environment metrics (EKS/ECS, etc.) with PromQL while AWS handles scale and long-term retention. Amazon Managed Grafana visualizes and alerts on metrics/logs/traces from multiple data sources (CloudWatch, Prometheus, X-Ray, etc.) in one dashboard. The selection rule of thumb: choose AMP + Managed Grafana when you want to reuse existing Prometheus/Grafana assets or PromQL, standardize dashboards on a multi-cloud/OSS baseline, or run Kubernetes-centric monitoring with standard tooling; the native CloudWatch metrics/dashboards suffice when staying all-AWS. In both cases AWS operates the underlying platform (scaling, patching, availability), so the DevOps team focuses on what to monitor.
| What you want | Service | When to use |
|---|---|---|
| Prometheus-compatible metrics queried with PromQL | Amazon Managed Service for Prometheus | Kubernetes-centric monitoring (EKS/ECS) |
| Visualize multiple sources in one dashboard | Amazon Managed Grafana | OSS-standard/multi-cloud unified dashboards |
4.3.3Automated best-practice checks (Trusted Advisor)
Beyond watching individual metrics, AWS Trusted Advisor checks your whole environment against best practices, surfacing recommendations across five categories: cost optimization, performance, security, fault tolerance, and service limits (Service Quotas). In DevOps, you consume Trusted Advisor check results via EventBridge and auto-remediate with Lambda/SSM, or turn an approaching service limit into a quota-increase request—using it as a trigger for operational automation. All checks are enabled with Business/Enterprise Support. Don’t confuse "improvement advice for your environment = Trusted Advisor" with "AWS-side service health = Health Dashboard."
4.3.4Section summary
- Tracing = X-Ray / correlate = ServiceLens / outside-in = Synthetics
- Detail = Container/Lambda Insights / audit = CloudTrail
- OSS observability = Managed Service for Prometheus (PromQL) + Managed Grafana (unified dashboards)
- Cross-cutting checks = Trusted Advisor (cost/perf/security/fault-tolerance/limits; auto-remediate via EventBridge)
Sign in to track progress — Log in.
Quick check
(just a quick review)Q1. You want to visualize which service is the latency bottleneck across microservices via tracing. What?
Q2. You want to periodically monitor key endpoints from a user perspective (outside-in). What?
Q3. You want to correlate metrics, logs, and traces in one view to find root cause fast. What?
Keep track of your progress
The full study guide is free to read. Sign up free to practice with the question bank, track what you have read, review your mistakes, and highlight passages.