

What's changed: In-scope coverage (fix): added a Trusted Advisor best-practice-checks block to §4.3 (closes an Axis-B textbook gap)
4.1Metrics and Alarms
Understand metric monitoring—CloudWatch metrics (standard/custom), alarms, composite alarms, dashboards, and EventBridge. Detect anomalies and drive notifications/automation.
Monitoring starts with metrics and alarms. CloudWatch collects metrics and triggers notifications/automation on threshold breach.
4.1.1CloudWatch metrics and alarms
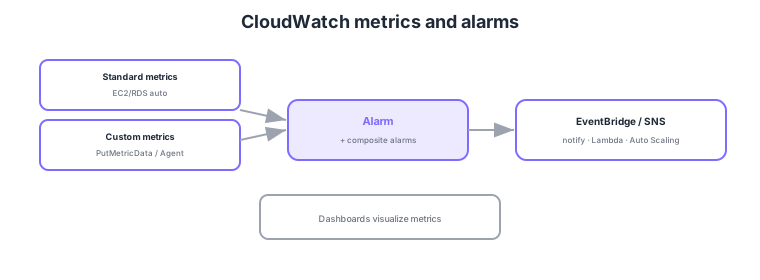
- Standard/custom metrics: standard are auto-collected; send custom (e.g., memory) via PutMetricData.
- Alarms: transition OK/ALARM/INSUFFICIENT_DATA on thresholds and trigger actions.
- Composite alarms: logically combine alarms to reduce false positives (noise).
- EventBridge: react to alarms/events to trigger SNS/Lambda/Auto Scaling automatically.
Common on DOP-C02: capture memory etc. = custom metrics (PutMetricData / CloudWatch Agent), combine conditions = composite alarms, alarm → notify/automate = SNS/EventBridge/Lambda. EC2 memory/disk are not standard metrics—use the CloudWatch Agent.
DOP-C02 probes designing "low-noise, actionable monitoring." Metrics have namespaces, dimensions, and resolution (standard 1-minute / high-resolution 1-second); EC2 memory/disk are not available by default, so send them as custom metrics via the CloudWatch Agent. Alarms use period, evaluation periods, and datapoints to alarm (M of N) to suppress false alerts from short spikes, and can specify missing-data treatment. Anomaly Detection learns a dynamic band with ML, reducing false positives versus fixed thresholds for seasonal metrics. Composite alarms combine alarms with AND/OR to curb alert fatigue—e.g., "notify only when both DB and web are abnormal." Alarm actions can directly target SNS (notify), EC2/Auto Scaling actions, and Systems Manager (OpsItem/Incident), while more complex automation flows through EventBridge rules → Lambda/SSM Automation/Step Functions. Across an org, centralize metrics to a monitoring account with cross-account observability. Crucially, tie each alarm to "who does what, how (a runbook)"—don’t stop at notification.
| Requirement | Feature | Key point |
|---|---|---|
| Capture non-standard metrics | Custom metrics / Agent | Memory/disk/business KPIs |
| Suppress short-spike noise | M-of-N evaluation; missing-data | evaluation/datapoints to alarm |
| Follow seasonality | Anomaly Detection | ML learns a dynamic band |
| Reduce alert fatigue | Composite alarms | Combine conditions with AND/OR |
Scenario: Alarms fire every time nightly batch briefly spikes CPU, exhausting operators. Notify only on real problems. → Set the alarm to M of N (e.g., 3 of 5 datapoints over 5 minutes) to ignore momentary spikes, and adopt an Anomaly Detection band for seasonality. Then AND-combine "high CPU AND high error rate" with a composite alarm, notifying via SNS only when truly degraded.
FAQ: Static threshold or anomaly detection? If the normal range is stable, a static threshold is simple and sufficient. For metrics that vary by time of day/day of week (e.g., traffic), static thresholds cause false positives, so ML-banded anomaly detection fits better. Mixing both—static thresholds for hard, definitive conditions and anomaly detection for trend-based anomalies—works well.
Exam trap: For "create an alarm on EC2 memory usage," trying to do it with standard metrics alone is wrong. Memory/disk don’t exist as standard metrics, so send them as custom metrics via the CloudWatch Agent (or PutMetricData) first, then alarm. CPU and network are standard, but memory is not.
4.1.2Section summary
- Metrics = standard + custom (PutMetricData/Agent)
- Alarms = composite alarms + EventBridge/SNS automation
Sign in to track progress — Log in.
Quick check
(just a quick review)Q1. You want to monitor EC2 memory usage, which is not a standard metric. What do you do?
Q2. You want to combine alarms logically to notify only on truly serious conditions, reducing noise. What?
Q3. When an alarm enters ALARM, you want to notify and also auto-invoke a remediation Lambda. What?
Keep track of your progress
The full study guide is free to read. Sign up free to practice with the question bank, track what you have read, review your mistakes, and highlight passages.