

What's changed: In-scope coverage (fix): added a Trusted Advisor best-practice-checks block to §4.3 (closes an Axis-B textbook gap)
4.2Log Management
Understand log collection and analysis—CloudWatch Logs, Logs Insights (queries), metric filters, subscription filters, and centralized logging (Amazon Data Firehose → S3/OpenSearch). Gain insight and detection from logs.
Logs are about collecting, searching, analyzing, and centralizing. Centered on CloudWatch Logs, leverage filters and streaming.
4.2.1Log collection and analysis
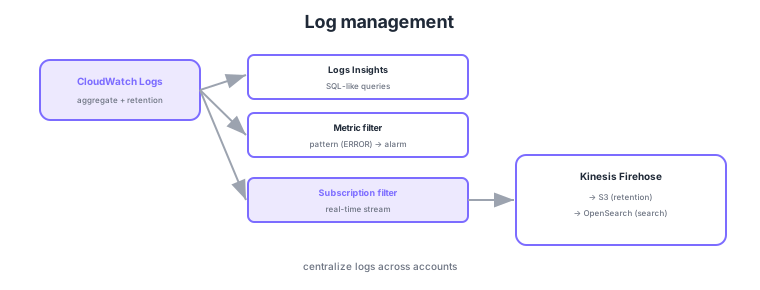
- CloudWatch Logs: aggregate logs with retention; collect from agents/services.
- Logs Insights: analyze logs fast with SQL-like queries.
- Metric filters: turn log patterns (e.g., ERROR) into metrics to drive alarms.
- Subscription filters: stream logs in real time to Firehose/Lambda, centralizing to S3/OpenSearch.
Common on DOP-C02: query analysis = Logs Insights, alarm on log patterns = metric filters, real-time forwarding/centralization = subscription filters → Firehose → S3/OpenSearch. Org-wide log centralization is typically subscription filters + Firehose.
For "alert when a string (e.g., NullPointerException) appears," use a metric filter → alarm. Use S3 for long-term retention and OpenSearch for full-text search/visualization.
DOP-C02 log design probes choosing the right service at each step: collect → analyze → detect → centralize. CloudWatch Logs sets retention per log group (infinite is possible but watch cost), and the unified CloudWatch Agent ships metrics and logs together from EC2/on-prem. Logs Insights searches large logs with SQL-like syntax (fields/filter/stats/sort), and common queries can be saved. Metric filters count/extract log patterns into metrics that drive alarms (note they do not apply retroactively to past logs). Real-time delivery uses subscription filters to Kinesis Data Streams/Firehose/Lambda. Across an org, send from each account’s log groups to a central account’s Firehose, aggregating to S3 (long-term, cheap, queryable with Athena) or OpenSearch (full-text search, dashboards). For tamper resistance, combine S3 Object Lock or API-audit CloudTrail (→ CloudWatch Logs / S3). For cost optimization, suppressing unneeded debug logs, revisiting retention, and log sampling/filtering are also DevOps responsibilities.
| Goal | Feature | Key point |
|---|---|---|
| Interactive log analysis | Logs Insights | SQL-like queries; savable |
| Detect log patterns | Metric filter → alarm | Count ERROR, etc. (no retroactive) |
| Forward in real time | Subscription filter | To Kinesis/Firehose/Lambda |
| Retention / full-text search | S3 / OpenSearch | Cheap storage = S3; search = OpenSearch |
Scenario: Collect app logs from dozens of accounts in one place—full-text search for security investigations and 7-year retention for audit. → Stream from each account’s subscription filter to a central account’s Amazon Data Firehose, fanning out to both OpenSearch (full-text search/dashboards) and S3 (7-year retention, Object Lock). S3 supports ad-hoc Athena analysis while keeping long-term cost low.
FAQ: Metric filter vs subscription filter? A metric filter turns log patterns into metrics for alarms (stays within CloudWatch). A subscription filter streams matching logs in real time to external targets (Kinesis/Firehose/Lambda) for centralized processing/forwarding. Use metric filters for detection, subscription filters for forwarding/centralization.
Exam trap: A metric filter applies only to logs arriving after it is configured—it does not apply retroactively. To "count occurrences in past logs," query with Logs Insights. Also, keeping all long-term bulk retention in CloudWatch Logs is costly—offload retention to S3 and search/visualization to OpenSearch.
4.2.2Large-scale analysis/visualization of logs and operational data
Logs and operational data collected in S3 are explored with the analysis service that fits the goal. Athena runs serverless SQL queries over data in S3—good for ad-hoc investigation and cost/access-log analysis with no infrastructure to manage (the staple for the centralized logging above). Amazon EMR runs large-scale batch/distributed processing with Spark/Hadoop, used for TB-scale log ETL and complex aggregations that are heavy for Athena. Amazon QuickSight visualizes results as BI dashboards, sharing operational KPIs and cost with stakeholders. Amazon AppFlow performs no-code data integration between SaaS (e.g., monitoring/ticketing SaaS) and AWS, ingesting external data into the analysis layer. In DevOps these are the downstream analysis layer that "turns observability data into decisions"—distinct in role from real-time detection (metric filters/alarms).
4.2.3Section summary
- Analysis = Logs Insights / detection = metric filter → alarm
- Centralization = subscription filters → Firehose → S3/OpenSearch
- Large-scale analysis = Athena (SQL) / EMR (distributed); visualization = QuickSight; SaaS integration = AppFlow
Sign in to track progress — Log in.
Quick check
(just a quick review)Q1. You want to analyze large logs with SQL-like queries to find entries fast. What?
Q2. You want an alarm when a specific error string appears a certain number of times in logs. What?
Q3. You want to aggregate logs from many accounts in real time and forward centrally to S3/OpenSearch. What?
Keep track of your progress
The full study guide is free to read. Sign up free to practice with the question bank, track what you have read, review your mistakes, and highlight passages.