

What's changed: Deepened AZ-500 Chapter 4 (ja figures; comparison tables/scenarios/FAQ/traps/deep paragraphs in all sections)
4.1Logging, Monitoring, and Security Alerts
Understand Azure Monitor, the Log Analytics workspace, and diagnostic settings as the foundation of security operations. Recording what happened and collecting/analyzing/retaining logs is the prerequisite for detection and investigation.
To detect and investigate attacks, you first need records of "what happened." In Azure, diagnostic settings route each resource’s logs into a Log Analytics workspace for analysis.
4.1.1Collecting and analyzing logs
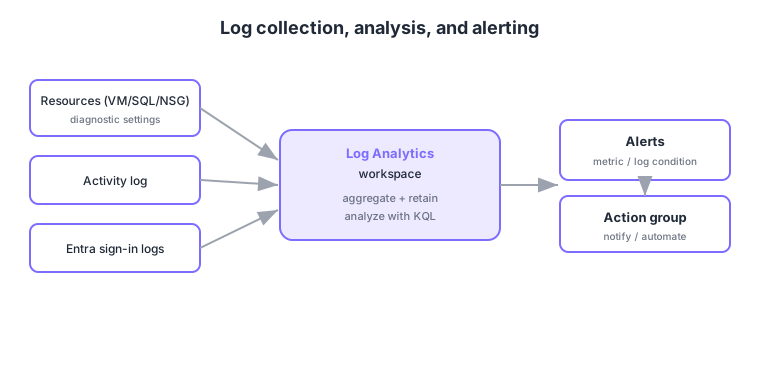
- Log Analytics workspace: the store that aggregates/retains logs and is queried with KQL (Kusto Query Language).
- Diagnostic settings: route each resource’s logs/metrics to a workspace, storage, or Event Hub.
- Activity log: records operations in the subscription (who changed what).
- Alerts: fire on metric or log-query conditions and notify/automate via action groups.
Common on AZ-500: aggregate logs and analyze with KQL = Log Analytics workspace, decide where resource logs go = diagnostic settings, who changed what = activity log, fire on conditions and notify = alerts + action groups. Sentinel also runs on this workspace.
Entra ID sign-in and audit logs can also be sent to Log Analytics via diagnostic settings, useful for identity investigations.
A diagnostic setting can target three destinations for different purposes: a Log Analytics workspace for KQL queries, alerts, and Sentinel integration; a storage account for low-cost long-term archival; and an Event Hub to relay to external SIEMs or for real-time integration. You also need to distinguish log types: the activity log is management operations (control plane: create/modify/delete), resource logs are a resource’s internal operations (data plane: enabled via diagnostic settings), and metrics are numeric time series. Alerts split into metric alerts (thresholds) and log (scheduled) alerts (KQL result counts), both wired to an action group (email, SMS, webhook, Logic Apps, Automation Runbook) for notification or automated response. Retention is governed by the workspace (free tier is short; for longer use the archive tier or export to Storage), and immutable storage helps make audit logs tamper-resistant.
| Destination | Best for | Querying |
|---|---|---|
| Log Analytics workspace | Analysis, alerts, Sentinel | Yes (KQL) |
| Storage account | Long-term, low-cost archive | Not directly |
| Event Hub | External SIEM, real-time integration | Relay only |
Scenario: audit requires retaining all operation logs for 1+ years in a tamper-proof form. → Send to Log Analytics for analysis while also exporting via diagnostic settings to a storage account with an immutability policy. Add an Event Hub if you must also relay to an external SIEM in real time.
FAQ: Q. Activity log vs resource logs? → A. The activity log is “who operated what in the subscription” (control plane); resource logs are “what happened inside a resource” (data plane) and must be enabled via diagnostic settings. Q. Metric vs log alerts? → A. Numeric thresholds (e.g., CPU) use metric alerts; counts of a specific pattern (KQL) use log alerts.
Trap: “resource logs flow into Log Analytics automatically without diagnostic settings” is wrong—the activity log is visible by default, but resource logs (data plane) aren’t aggregated unless you explicitly route them via diagnostic settings.
4.1.2Section summary
- Log Analytics = aggregate logs, KQL analysis, diagnostic settings = route logs
- Alerts + action groups = fire on conditions, notify/automate
Sign in to track progress — Log in.
Quick check
(just a quick review)Q1. Which platform aggregates/retains Azure resource logs and is queried with KQL?
Q2. What do you configure to send a resource’s logs to a Log Analytics workspace?
Q3. Which log shows "who changed which resource and when" in a subscription?
Keep track of your progress
The full study guide is free to read. Sign up free to practice with the question bank, track what you have read, review your mistakes, and highlight passages.