

What's changed: Deepened AZ-104 Chapter 5 to Associate depth (tables, scenarios, FAQ, traps; localized figures)
5.1Monitoring with Azure Monitor
Understand monitoring basics: Azure Monitor metrics and logs (Log Analytics / KQL), alerts and actions, and connection diagnostics with Network Watcher.
Stable operations require monitoring—knowing what is happening now. Azure Monitor is the monitoring platform, collecting metrics and logs.
5.1.1Metrics, logs, and alerts
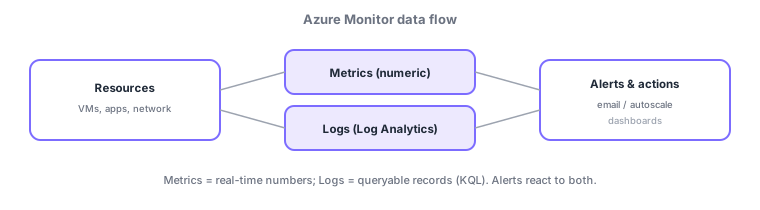
- Metrics: numeric time-series like CPU usage; near real-time.
- Logs: records of events/diagnostics, collected in Log Analytics and analyzed with KQL.
- Alerts: fire on conditions like threshold breaches and run actions like email or autoscale.
- Network Watcher: performs network diagnostics like connection checks and packet capture.
Common on AZ-104: numeric time-series = metrics, log aggregation/analysis = Log Analytics + KQL, notify/auto-respond on conditions = alerts + action groups, network diagnostics = Network Watcher.
Design monitoring as "what to collect (metrics/logs) → where to store (workspace) → how to notify/respond (alerts/actions)." Metrics are near real-time numeric time-series, visualized in Metrics Explorer. Logs aggregate into a Log Analytics workspace and are queried/analyzed with KQL. Routing each resource’s logs/metrics to a workspace/storage/event hub needs a diagnostic setting, and collecting in-VM data needs the Azure Monitor Agent (AMA). Alerts fire on metric/log/activity-log conditions and run notifications/automation via action groups (email/SMS/webhook/Automation runbook/Logic Apps). App performance uses Application Insights, resource operation history uses the activity log, and network diagnostics use Network Watcher (connection troubleshoot/IP flow verify/flow logs). The axes: "numeric trend = metrics," "log analysis = Log Analytics + KQL," "notify/auto-respond on conditions = alerts + action groups," "app performance = Application Insights," "network diagnosis = Network Watcher."
| What you want | Use |
|---|---|
| Numeric trend (CPU, etc.) | Metrics |
| Log aggregation/analysis | Log Analytics + KQL |
| Notify/auto-respond on conditions | Alerts + action groups |
| Diagnose connectivity | Network Watcher |
Scenario: notify on sustained high VM CPU and also inspect logs. Install the Azure Monitor Agent on the VM and route logs to Log Analytics via a diagnostic setting. Create a CPU metric alert and use an action group to email (and optionally restart via an Automation runbook). Investigate with KQL over the time window, and isolate connectivity issues with Network Watcher.
Q. Numeric trend? Metrics. Q. Log analysis? Log Analytics + KQL. Q. Collect logs? Diagnostic settings (+ AMA on VMs). Q. Notify/auto-respond? Alerts + action groups. Q. App performance? Application Insights. Q. Network diagnosis? Network Watcher.
Watch the mix-ups: (1) Metrics (numeric, near real-time) ≠ logs (records, KQL)—use each appropriately. (2) Storing/querying logs needs a Log Analytics workspace + diagnostic setting (not sent by default). (3) In-VM metrics/logs need the agent (AMA). (4) An alert’s "who to notify/what to do" is separated into an action group.
Storing and querying logs needs a Log Analytics workspace. Diagnostic settings route each resource’s logs to the workspace.
5.1.2Section summary
- Collect metrics (numeric) / logs (Log Analytics + KQL)
- Use alerts + actions to notify/auto-respond; diagnose with Network Watcher
Sign in to track progress — Log in.
Quick check
(just a quick review)Q1. You want to view numeric values like CPU usage over time. What in Azure Monitor do you check?
Q2. Which platform aggregates collected logs and lets you query/analyze them with KQL?
Q3. You want to auto-notify or scale when CPU exceeds a threshold. What do you use?
Keep track of your progress
The full study guide is free to read. Sign up free to practice with the question bank, track what you have read, review your mistakes, and highlight passages.