

What's changed: Deepened MLS-C01 Chapter 2 (Pearson/Spearman/VIF/log transform, AWS viz tools/pitfalls/t-SNE, two leakage kinds/preprocessing order/Glue DataBrew/time-series split + tables, scenarios, FAQ, traps; ja figures)
2.1Statistics and Distributions
Know your data—understand summary statistics (mean/median/variance), distributions, outliers, class imbalance, and correlation. Grasp the data before modeling.
Before modeling, use exploratory data analysis (EDA) to understand the data. Inspect summary statistics, distributions, outliers, and correlations to decide on preprocessing.
2.1.1Understand the data first
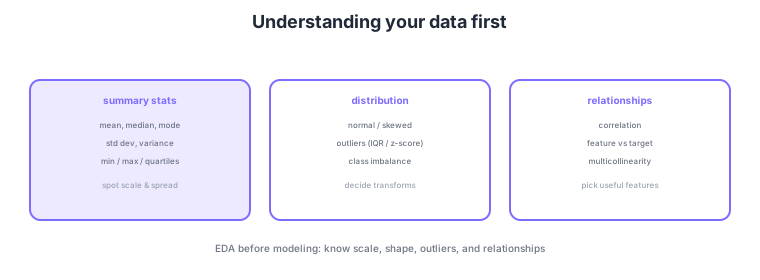
- Summary stats: grasp scale and spread via mean, median, mode, std dev, quartiles.
- Distribution & outliers: check normal/skewed and detect outliers via IQR or z-score.
- Class imbalance: in classification, check skew in class counts (needs handling later).
- Correlation: examine feature–target relationships and multicollinearity (strong feature–feature correlation).
Common on MLS-C01: outlier detection = IQR/z-score, correct skewed distributions with log transforms, strong feature–feature correlation = multicollinearity (drop redundant features), and class imbalance distorts accuracy. Also: the mean is sensitive to outliers while the median is robust.
MLS-C01 probes correlation types and skew-correction decisions deeply. Distinguish Pearson (measures linear relationship) from Spearman (rank-based, captures monotonic even if nonlinear); with outliers or nonlinearity Pearson can mislead, so confirm with Spearman or a scatter plot. Remember correlation is not causation—strong correlation guides feature selection but does not prove causality. Quantify multicollinearity with VIF (variance inflation factor); as a rule of thumb, features with VIF > 5–10 destabilize linear-model coefficients, so drop one or reduce dimensions with PCA (tree models are relatively robust to it). For skewed distributions (income/price with a long right tail), a log transform or Box-Cox/Yeo-Johnson brings them closer to normal, easing linear and distance-based methods. Detect outliers via IQR (below Q1−1.5×IQR / above Q3+1.5×IQR) or z-score (|z|>3), but whether to remove or keep depends on whether an outlier is measurement error or an important rare event (e.g., fraud). Noticing sampling bias (training data not representative of the population) and time-series leakage (predicting the past with future information) during EDA strongly affects downstream model quality.
| Measure/concept | Meaning | Use/caution |
|---|---|---|
| Pearson | Strength of linear relation | Sensitive to outliers/nonlinearity |
| Spearman | Rank (monotonic) | Captures monotonic nonlinearity |
| VIF | Degree of multicollinearity | >5–10 redundant / unstable coeffs |
| IQR / z-score | Outlier detection | Remove vs keep by error/rare event |
Scenario: predicting house prices, the price distribution is heavily right-skewed and area/rooms/age are strongly correlated. → Log-transform price toward normality, check correlated features with VIF and drop one (or use PCA). Confirm correlation with Spearman and a scatter plot, and decide on outliers (extremely large homes) only after judging whether they are measurement errors or a genuine high-price segment.
FAQ: Q. Pearson vs Spearman? A. Pearson for linear, Spearman for rank/monotonic nonlinearity; Spearman is also robust with many outliers. Q. Where does multicollinearity matter? A. It destabilizes coefficients in linear/logistic regression; tree models (e.g., XGBoost) are relatively robust. Q. Always remove outliers? A. No—keep them when outliers are the point, as in fraud detection.
Trap: "high correlation = causation" is false—correlation only shows association, not cause. Also "keeping both highly correlated features always improves accuracy" is wrong: in linear models multicollinearity destabilizes coefficients and harms interpretability. Drop redundant features or reduce dimensions.
2.1.2Section summary
- EDA = inspect summary stats, distribution, outliers, correlation
- Outliers = IQR/z-score; redundant features = multicollinearity
Sign in to track progress — Log in.
Quick check
(just a quick review)Q1. Statistically detect outliers in a numeric feature. Common method?
Q2. What is strong correlation among features called, and how do you handle it?
Q3. Which pair correctly contrasts an outlier-sensitive vs a robust central measure?