

What's changed: Deepened DP-300 Chapter 4 (ja figures; comparison tables/scenarios/FAQ/traps/deep paragraphs in all sections)
4.2Configuring Alerts and Notifications
Understand alerts that fire on metric/log conditions, action groups for notification/automated response, and notifications on job failures. Detect issues early and respond automatically to stabilize operations.
Automation includes not just "execution" but also "detecting and notifying anomalies." Learn of high CPU or job failures early and trigger automated responses.
4.2.1Alerts and notifications
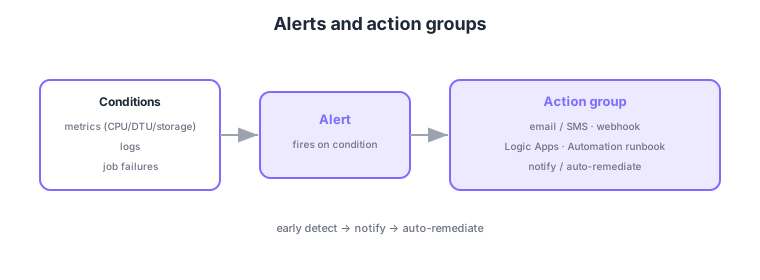
- Alerts: fire on metric (CPU/DTU/storage) or log conditions.
- Action groups: notify/auto-respond via email/SMS, webhook, Logic Apps, Automation runbooks.
- Job notifications: alert on failures of SQL Agent/Elastic Jobs to avoid missing them.
- Auto-remediation: trigger runbooks/Logic Apps from alerts to automate routine responses.
Common on DP-300: fire on conditions = alerts, notify/auto-respond = action groups (email, webhook, runbook), notify on job failures, alert → runbook for auto-remediation. Combine monitoring (prev. chapter), alerts, and Automation.
An Azure Monitor alert rule consists of a target resource, a condition (signal), an action group, and a severity (Sev0–4). Signals split into metric alerts (thresholds on CPU%/DTU%/storage%, with dynamic thresholds that auto-learn) and log (scheduled) alerts (result counts from Log Analytics KQL). An action group bundles notifications (email/SMS/push/voice) and actions (webhook, Logic Apps, Automation runbook, Functions, ITSM integration) and is reused across alerts. SQL Agent jobs notify via operators; Elastic Jobs/Automation detect failures from output/status and raise alerts. Use alert state (new/acknowledged/closed) and suppression (alert processing rules) to reduce noise and duplicate notifications and prevent alert storms. The design knack is a closed loop: “measure with monitoring (metrics/logs) → detect with alerts → notify via action groups → auto-remediate with runbooks/Logic Apps where possible.”
| Alert type | Source | Example |
|---|---|---|
| Metric alert | Numeric metric threshold | CPU% > 90 for 5 min |
| Log (scheduled) alert | KQL result count in Log Analytics | Spike in error-log count |
| Job failure notification | SQL Agent operator/job status | Nightly batch failure |
Scenario: when storage exceeds 90%, notify the owner and, if possible, auto-expand capacity. → Create a metric alert (storage% > 90) and an action group that emails and runs an Automation runbook to expand capacity. Suppress duplicate notifications with alert processing rules and set severity appropriately.
FAQ: Q. Metric vs log alert? → A. Numeric thresholds like CPU% use metric alerts; counts of a specific pattern (KQL) use log alerts. Q. Receiving the same alert repeatedly? → A. Suppress/group with alert processing rules and reuse action groups.
Trap: “an alert auto-fixes the problem” is wrong—an alert only detects/fires; auto-remediation happens by triggering a runbook/Logic Apps from the action group. Also “configure recipients (email, etc.) directly in the alert rule” is wrong—notifications/actions are bundled in a reusable action group.
4.2.2Section summary
- Alerts = fire on conditions, action groups = notify/auto-respond
- Notify on job failure + auto-remediate via runbook
Sign in to track progress — Log in.
Quick check
(just a quick review)Q1. You want to notify when CPU exceeds a threshold. What do you configure in Azure?
Q2. What bundles responses (email, runbook execution) to fire when an alert triggers?
Q3. What helps you not miss a nightly batch job failure?
Keep track of your progress
The full study guide is free to read. Sign up free to practice with the question bank, track what you have read, review your mistakes, and highlight passages.