

What's changed: Deepened AZ-400 Chapter 1 (added comparison tables, scenarios, FAQs, exam traps, deep-dive paragraphs to each section; localized figures to Japanese)
1.2DevOps Metrics and Flow
Understand DevOps improvement metrics—DORA metrics (deployment frequency/lead time for changes/change failure rate/MTTR), cycle time, and dashboards. Improve continuously with data.
Improvement starts with measurement. The four DORA metrics measure delivery speed and stability to find bottlenecks.
1.2.1DORA metrics
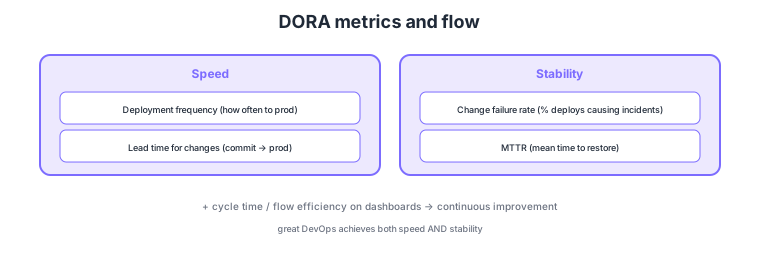
- Deployment frequency: how often you release to production (speed).
- Lead time for changes: time from commit to running in production (speed).
- Change failure rate: fraction of deployments causing incidents/rollbacks (stability).
- MTTR: mean time to restore from failure (stability); visualize continuously on dashboards.
Common on AZ-400: the four DORA metrics—speed = deployment frequency, lead time for changes; stability = change failure rate, MTTR. Speed and stability are not a trade-off; great DevOps achieves both. Track cycle time and flow efficiency on dashboards too.
AZ-400 probes a "continuously improve with data" mindset. The four DORA metrics are research-based standards for delivery performance: speed = deployment frequency (how often you release to prod) and lead time for changes (commit → prod), stability = change failure rate (fraction of deployments causing incidents/rollbacks) and MTTR/time to restore from failure. Elite organizations raise all four simultaneously—speed and stability are not either/or (small frequent deploys + automated tests + auto-rollback lift both). Compute and visualize these from Azure Pipelines analytics, Boards Analytics (OData), dashboard widgets, and Application Insights/Azure Monitor. Run the loop "measure → find bottleneck → small experiment → re-measure": long lead time → parallelize pipelines or speed tests; high change failure rate → strengthen review/test/progressive delivery (canary); long MTTR → improve monitoring/alerting and auto-rollback/runbooks. Value stream mapping to visualize per-stage wait (flow efficiency) also helps. The key is to continuously measure the four metrics as a baseline and run targeted improvements at the bottleneck.
| DORA metric | Category | Example improvement |
|---|---|---|
| Deployment frequency | Speed | Small deploys; automated pipelines |
| Lead time for changes | Speed | Faster tests; parallelism; lean approvals |
| Change failure rate | Stability | Automated tests; canary; quality gates |
| MTTR | Stability | Monitoring/alerts; auto-rollback |
Scenario: Deployment frequency is high but change failure rate is high with frequent production incidents. → DORA reveals "fast but unstable." On the stability side, strengthen automated tests/quality gates in the pipeline and introduce canary/progressive delivery + auto-rollback (tied to Azure Monitor alerts). Re-measure to confirm change failure rate and MTTR drop, raising stability without sacrificing speed.
FAQ: Aren’t speed and stability a trade-off? DORA research shows elite organizations excel at all four metrics—they coexist. The key is mechanisms that are "small and frequent, guarded by automated tests, with fast recovery." Large, rare deploys are riskier; small, automated, progressive delivery lifts speed and stability together.
Exam trap: Don’t confuse code coverage or lines of code (LOC) with DORA metrics. DORA is the four—deployment frequency, lead time, change failure rate, MTTR; coverage is only an auxiliary quality signal. Also, "just increase deployment frequency" is insufficient—without also watching change failure rate/MTTR (stability), you get fast but fragile delivery.
1.2.2Section summary
- Speed = deployment frequency / lead time
- Stability = change failure rate / MTTR (visualized on dashboards)
Sign in to track progress — Log in.
Quick check
(just a quick review)Q1. You want to measure whether commit-to-production time is shrinking. Which DORA metric?
Q2. You want to measure improvement in average time to recover from incidents. Which metric?
Q3. Which DORA metrics represent delivery "stability"?
Keep track of your progress
The full study guide is free to read. Sign up free to practice with the question bank, track what you have read, review your mistakes, and highlight passages.