

What's changed: Deepened AZ-305 Chapter 1 (added comparison tables, scenarios, FAQs, exam traps, deep-dive paragraphs to each section; localized figures to Japanese)
1.3Designing Monitoring
Understand designing observability—Azure Monitor, Log Analytics (KQL), Application Insights, alerts/action groups, and Network Watcher. Make operations visible with metrics, logs, and traces.
Operational health relies on monitoring. Centered on Azure Monitor, design observability for metrics, logs, and apps.
1.3.1Monitoring composition
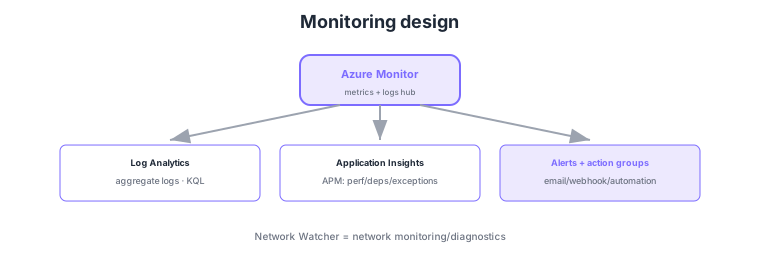
- Azure Monitor: the monitoring hub aggregating metrics and logs.
- Log Analytics: a workspace aggregating logs, analyzed with KQL.
- Application Insights: track app performance, dependencies, exceptions (APM).
- Alerts/action groups: fire on thresholds/queries to trigger notifications or automated actions.
Common on AZ-305: monitoring hub = Azure Monitor, log aggregation/KQL analysis = Log Analytics, app APM = Application Insights, notify/automate = alerts + action groups, network diagnostics = Network Watcher. Aggregate cross-cutting logs into a Log Analytics workspace.
AZ-305 monitoring design assembles "what to collect, where, and how to notify/analyze" from requirements. Azure Monitor handles two streams—platform metrics (auto-collected numeric time series) and logs—routing platform logs/metrics per resource via Diagnostic Settings to a Log Analytics workspace, storage (long-term/audit retention), or Event Hubs (forwarding to external SIEM). Log Analytics analyzes logs cross-cuttingly with KQL, with workspace design across subscriptions (centralized vs distributed) being a key topic. Application Insights provides app APM—dependency maps, transaction search, live metrics, and availability tests (outside-in)—integrating with Log Analytics in workspace-based mode. Alerts fire on metric/log (KQL)/activity-log conditions, triggering action groups (email/SMS/webhook/Logic Apps/Automation Runbook/ITSM), with alert processing rules for suppression or maintenance-window muting. Network Watcher diagnoses networking with IP flow verify, connection monitor, NSG flow logs, and packet capture. The design key is to aggregate logs into the right workspace and design retention (cost) and access control, then tie severity-appropriate alerts to actions.
| Monitoring goal | Service | Key point |
|---|---|---|
| Centralize metrics/logs | Azure Monitor + Diagnostic Settings | Send to Log Analytics/storage/Event Hubs |
| Cross-cutting log analysis | Log Analytics (KQL) | Workspace design; retention |
| App perf/exception tracking | Application Insights | Dependency map; availability tests |
| Notify and automate | Alerts + action groups | Email/webhook/Runbook/ITSM |
Scenario: Centrally analyze logs from VMs, App Service, and networking across subscriptions—notify immediately on critical errors and retain the rest for analysis. → Send logs via each resource’s Diagnostic Settings to a centralized Log Analytics workspace and analyze cross-cuttingly with KQL. Use Application Insights for app APM. Detect critical errors with log alerts (KQL) and notify the on-call via an action group, optionally triggering an Automation Runbook. Archive logs needing long retention to storage as well.
FAQ: Centralized or distributed Log Analytics workspaces? For cross-cutting analysis and unified RBAC/retention, prefer centralized (few workspaces). For data sovereignty (region isolation), per-team separation, or billing separation, use distributed. Often a hybrid—"centralize, but split only as regulations/region requirements demand"—is the practical answer.
Exam trap: Relying on "Log Analytics alone" for in-app performance (dependency latency, exceptions) is a weak design—APM is Application Insights. Also, resource logs do not flow to Log Analytics unless Diagnostic Settings are configured (not sent by default). Network Watcher is for network-layer diagnostics, not VM/app metrics.
1.3.2Section summary
- Monitoring = Azure Monitor + Log Analytics (KQL)
- App = Application Insights / notify = alerts + action groups
Sign in to track progress — Log in.
Quick check
(just a quick review)Q1. You want to centrally aggregate logs from many resources and analyze them with KQL. What?
Q2. You want to track a web app’s response times, dependencies, and exceptions to find performance issues. What?
Q3. When a metric exceeds a threshold, you want to trigger email/webhook/automation. What do you configure?
Keep track of your progress
The full study guide is free to read. Sign up free to practice with the question bank, track what you have read, review your mistakes, and highlight passages.