

What's changed: Initial version
6.2Operations research, IE & decision-making
Covers the quantitative tools for evaluating and choosing among alternatives—decision trees (decision-making by expected value), PERT/CPM (critical path and schedule shortening), linear programming, inventory management (EOQ), queueing, and the pitfalls of correlation and regression—so an IT strategist can wield them when judging investment plans and schedules.
An IT strategist must choose, from among multiple investment plans, schedules, and procurement options, the one that yields the greatest effect with limited resources—on a quantitative basis. Operations research (OR) and industrial engineering (IE) are the toolbox for this. This section covers, through settings where you actually compute and choose an alternative, the quantitative methods that support management decision-making: decision trees (decision-making by expected value) for choosing under uncertainty, PERT/CPM for spotting a project's earliest completion and the activity to shorten, linear programming for optimizing resource allocation, inventory management (EOQ) for optimizing order quantity, and the judgment of not mistaking correlation for causation.
6.2.1Decision-making by expected value (decision trees)
- Decision tree: a method that represents choices (decision nodes) and uncertain events (chance nodes) as a tree, computes each alternative's expected value (= the sum of each outcome's value times its probability), and, in principle, selects the alternative with the maximum expected value. It is used for judgments whose outcomes can only be read probabilistically, such as IT investment or whether to launch a new business.
- Beyond expected value, the magnitude of the worst-case loss (risk tolerance) is sometimes considered together. Even with a higher expected value, if the worst-case loss would shake the business, choosing a safer alternative can be justified—but when asked about "decision-making by expected value," the answer is the alternative with the maximum expected value.
6.2.2Optimizing schedule, resources, and inventory
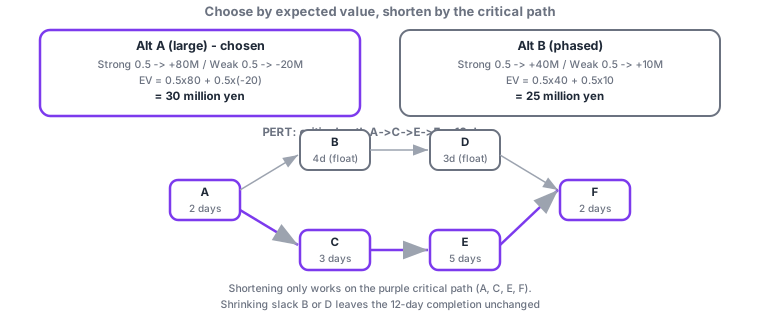
- PERT/CPM: represents activities' precedence in an arrow diagram and finds the longest path from start to finish = the critical path. The length of the critical path is the project's earliest completion, and the whole cannot be shortened without shortening an activity on this path. Shortening a non-critical activity with float does not change the completion date.
- Linear programming: an optimization method that maximizes or minimizes an objective function (profit, cost) under constraints (resource/capacity limits) for resource allocation. Inventory management (EOQ): finds the economic order quantity that minimizes the sum of ordering cost and holding cost, trading off the two. Queueing: evaluates waiting time and queue length from the probabilistic variation of arrivals and service.
- Correlation and causation are different. Even with strong correlation between two variables, one is not necessarily the cause of the other (a common factor such as seasonality, or reverse causation, may exist). The slope from regression analysis can be used for prediction, but the effect of a measure must not be asserted on correlation alone.
Most-tested: "expected value = sum of outcome value x probability; in principle choose the max-EV alternative", "critical path = longest path = earliest completion; shortening works only on an activity of this path", "EOQ minimizes the sum of ordering and holding costs", and "strong correlation does not mean causation". Watch for confusions like "shortening a slack activity shortens the whole" or "high correlation proves causation."
An IT strategist is judging whether to invest in a new digital service using a decision tree. There are two alternatives. Alternative A (large investment) yields a profit of 80 million yen if the market is strong (probability 0.5) and a loss of 20 million yen if the market is weak (probability 0.5). Its expected value is 0.5x80 + 0.5x(-20) = 40 - 10 = 30 million yen (in units of million yen: 0.5x8000 + 0.5x(-2000) = 3000 in ten-thousands). Alternative B (phased investment) yields 40 million yen if strong (0.5) and still 10 million yen if weak (0.5). Its expected value is 0.5x4000 + 0.5x1000 = 2000 + 500 = 25 million yen (2,500 in ten-thousands). Following the principle of decision-making by expected value, the answer is to choose Alternative A (30 million), whose expected value is higher—Alternative B is psychologically attractive because "it stays profitable even when weak, with no loss," but its expected value is below A's. What the strategist must grasp here is twofold: (1) "no loss" and "high expected value" are different evaluation axes, and when asked by expected value, A is correct; (2) yet if A's worst-case loss of 20 million exceeds the firm's resilience and would shake the business, choosing B by sacrificing some expected value is a defensible alternative judgment (risk tolerance). Next, the strategist tightens the development schedule with PERT. With activities A (2 days, no predecessor) -> B (4 days) and C (3 days) after A, D (3 days) after B, E (5 days) after C, and F (2 days) after both D and E, the paths are "A->B->D->F = 2+4+3+2 = 11 days" and "A->C->E->F = 2+3+5+2 = 12 days," so the critical path is A->C->E->F at 12 days. When management asks to "finish one day sooner," the strategist should invest resources in an activity on the critical path (C, E, A, or F). Activity B, which looks long at 4 days, is a non-critical activity with float, so no matter how much it is shortened, the overall completion of 12 days does not shrink. Expected value thus shows "which alternative to choose," and the critical path shows "where to invest resources to make a difference," both on a quantitative basis.
| Method | Optimizes/judges | Pitfall |
|---|---|---|
| Decision tree | Chooses max-EV alternative under uncertainty | "No-loss" alternative is not optimal (judge by EV) |
| PERT/CPM | Critical path = earliest completion / target to shorten | Shortening a slack activity does not shorten the whole |
| Linear programming | Max/min objective under constraints | Missing a constraint makes the optimum unrealistic |
| Inventory (EOQ) | Minimizes sum of ordering and holding cost | Minimizing only one cost raises total cost |
| Correlation/regression | Measures strength of relation; prediction | Correlation != causation (common factor, reverse) |
Trap: "In a decision tree, always choose the alternative with no loss" is wrong—decision-making by expected value chooses the alternative with the maximum expected value in principle, and the presence of loss is a separate axis (risk tolerance). Also wrong: "in PERT, shortening the longest-duration activity always shortens the whole"—shortening works only on an activity on the critical path, and shrinking a non-critical activity with float does not change the completion date. "A high correlation coefficient proves causation" is also wrong (correlation != causation).
6.2.3Section summary
- Decision trees compute each alternative's expected value (sum of value x probability) and, in principle, choose the max-EV alternative
- The critical path = longest path = earliest completion; shortening works only on this path, and shrinking a slack activity has no effect
- EOQ minimizes the sum of ordering and holding cost; correlation != causation (suspect a common factor or reverse causation)
Sign in to track progress — Log in.
Quick check
(just a quick review)Q1. In deciding whether to invest in a new digital service, Alternative A (large investment) yields a 80-million-yen profit if the market is strong (prob. 0.5) and a 20-million-yen loss if weak (0.5); Alternative B (phased) yields 40 million if strong (0.5) and 10 million if weak (0.5). Which is most appropriate as decision-making by expected value?
Q2. A system-introduction project consists of activities A-F: A (2 days, no predecessor), B (4 days, after A), C (3 days, after A), D (3 days, after B), E (5 days, after C), F (2 days, after both D and E). Which activity is most appropriate to invest resources in to finish even one day earlier?
Q3. A strong positive correlation (coefficient 0.9) is observed between web-advertising spend and sales. Which judgment by the IT strategist based on this result is most appropriate?
Keep track of your progress
The full study guide is free to read. Sign up free to practice with the question bank, track what you have read, review your mistakes, and highlight passages.