

What's changed: Service coverage: added a catalog section (s4) for developer tools and operations management (CI/CD, Grafana/Prometheus, Proton, Amplify/Device Farm)
3.1Operational Observability and Automation
Understand observability and operations for improving existing systems—CloudWatch (metrics/logs/alarms), X-Ray (distributed tracing), CloudTrail (API auditing), Systems Manager, and automation. Detect issues early and automate operations.
Improvement starts with measurement. Collect metrics, logs, traces, and audit data, then operate with alarms and automation.
3.1.1The observability stack
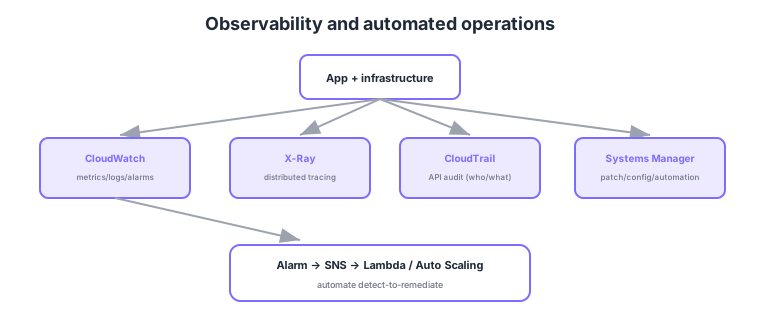
- CloudWatch: metrics/logs/alarms; trigger notifications or automated actions (e.g., scaling) on threshold breach.
- X-Ray: distributed tracing across microservices to pinpoint latency/bottlenecks.
- CloudTrail: API call audit logs (who/when/what); essential for security/compliance.
- Systems Manager: centrally patch, change config, and automate (Automation/Run Command).
Common on SAP-C02: metrics/logs/alarms = CloudWatch, trace latency = X-Ray, who-did-what API auditing = CloudTrail, patch/config automation = Systems Manager. Remember CloudTrail = auditing, CloudWatch = monitoring.
Chain CloudWatch alarm → SNS → Lambda/Auto Scaling to automate detect-to-remediate. For org-wide auditing, aggregate via a CloudTrail organization trail.
SAP-C02 tests precisely matching telemetry to the right service. CloudWatch handles numeric metrics, logs, and threshold-based alarms; cross-account telemetry can be centralized to a monitoring account via cross-account observability. X-Ray propagates a request ID to draw a service map showing which segment introduced latency or errors. CloudTrail keeps an immutable API-level record of who did what and when, splitting management events (resource operations) from data events (high-volume operations like S3 object access or Lambda invokes). Systems Manager connects via Session Manager without opening SSH/RDP, applies OS patches in waves with Patch Manager, and idempotently automates multi-step operations with Automation runbooks. Combined with EventBridge, detection flows into remediation with no human in the loop.
| Observability goal | Service | What it shows |
|---|---|---|
| Numeric trends / threshold | CloudWatch metrics/alarms | CPU, latency, error rate, etc. |
| Request path / latency | X-Ray | Service map, per-segment timing |
| Who did what | CloudTrail | API audit logs (mgmt/data events) |
| Config change / patch automation | Systems Manager | Run Command/Patch/Automation history |
Scenario: A production API has intermittent latency spikes, but CloudWatch averages hide the cause. → Enable X-Ray tracing; the service map reveals a specific downstream segment (e.g., an external DB call) driving p99. Set a CloudWatch alarm on p99 latency to catch recurrences instantly, and wire a Systems Manager Automation runbook to restart the cache automatically.
FAQ: CloudTrail vs CloudWatch Logs? CloudTrail specializes in an audit record of API operations (who called what, when); CloudWatch Logs is a platform for aggregating and searching arbitrary app/OS logs. A common combination—often tested—sends CloudTrail logs into CloudWatch Logs and fires an alarm via a metric filter on a specific API call.
Exam trap: Choosing CloudTrail for "configuration change history and compliance evaluation" is wrong—that is AWS Config. CloudTrail audits API calls; Config tracks configuration state and compliance.
3.1.2Section summary
- Monitoring = CloudWatch / tracing = X-Ray / auditing = CloudTrail
- Automation = Systems Manager (patch/config/Automation)
Sign in to track progress — Log in.
Quick check
(just a quick review)Q1. You want end-to-end tracing to find where requests slow down across microservices. What?
Q2. For a security investigation, you need an audit log of who called which API and when. What?
Q3. You want to patch and reconfigure hundreds of EC2 instances centrally and automatically, without SSH. What?
Keep track of your progress
The full study guide is free to read. Sign up free to practice with the question bank, track what you have read, review your mistakes, and highlight passages.