

What's changed: Initial version (topic G4)
4.1Common failure patterns
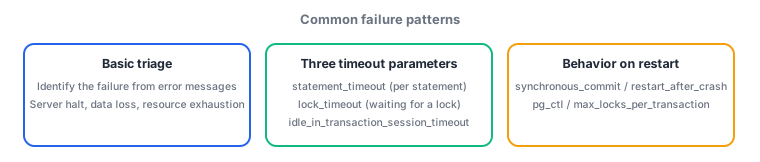
Learn the basics of failure triage: identifying issues from error messages, server stoppage, data loss, OS resource exhaustion, and process-state analysis; the timeout parameters statement_timeout, lock_timeout, and idle_in_transaction_session_timeout; synchronous_commit and restart_after_crash which govern post-crash consistency; server control via pg_ctl; and the lock-management ceiling max_locks_per_transaction.
Responding to a production database failure starts with precisely triaging what actually happened. Even a single symptom like "cannot connect to the server" can stem from a crashed process, OS resource exhaustion (full disk, low memory), a network outage, or simply hitting the connection limit under load. The Gold exam tests the judgment to identify the nature of a failure from error messages, process state, and configuration parameters, and choose the right first response.
4.1.1Diagnosis: error messages, processes, and resources
- Diagnosing from error messages—PostgreSQL logs (routed via
log_destination) tag entries with severities likeFATAL,PANIC, andERROR.PANICis the most severe: it crashes the entire server process and triggers an automatic restart. Messages likecould not write to file(write failure) orout of memorytypically signal OS resource exhaustion. - Analyzing server stoppage, data loss, OS resource exhaustion, and process state—the standard first-pass triage is checking whether the postmaster and backend processes are alive with
ps, disk usage withdf/du, and memory withfree. A full disk directly blocks WAL writes and can escalate to a crash, making it a top-priority cause to rule out.
4.1.2Timeout parameters and post-crash behavior
- statement_timeout—the maximum execution time (in milliseconds) for a single SQL statement; exceeding it cancels the statement automatically. A classic safety valve against runaway long-running queries.
- lock_timeout—the maximum time to wait to acquire a lock; exceeding it aborts with an error (often kicking in before statement_timeout does). idle_in_transaction_session_timeout—automatically disconnects sessions that stay idle while a transaction is still open (preventing prolonged lock retention from blocking other sessions).
- synchronous_commit—controls how strongly commit confirmation is guaranteed (on/off, etc.). Turning it off makes commit responses faster but risks losing the most recent committed transactions on a crash (it also affects the reliability of synchronous replication). restart_after_crash—controls whether the entire server automatically restarts after a backend process crashes (default is on).
- pg_ctl—the standard command for controlling the server process (
start/stop/restart/reload/status). When recovering from an abnormal termination,pg_ctl startattempts a restart, and it is important to understand that crash recovery (WAL replay) runs automatically. max_locks_per_transaction—a factor sizing the server-wide lock table (roughly, transaction count times this value); exceeding it raises anout of shared memoryerror, and operations requiring many locks (e.g., bulk operations across many tables) can fail.
The staples: PANIC is the most severe—it triggers a full crash plus automatic restart; statement_timeout applies per statement, lock_timeout applies to lock waits, and idle_in_transaction_session_timeout disconnects idle-in-transaction sessions; synchronous_commit=off makes commits faster but can lose the most recent transactions on a crash; restart_after_crash controls automatic restart after a backend crash; exceeding max_locks_per_transaction raises out of shared memory. Precisely distinguishing the scope of the three timeout parameters is key to scoring well.
Real incident response follows the pattern observe symptoms → hypothesize a cause → apply a first response → apply a permanent fix. Consider: "the application suddenly reports a flood of connection errors, and the server log shows PANIC: could not write to file \"pg_wal/...\"". First, observe symptoms: check whether the process is alive with pg_ctl status, and disk usage with df -h. If the disk is full, that confirms the hypothesis that this is a PANIC caused by an inability to write WAL. The first response is to free space by deleting unnecessary files (old logs, temp files), then restart the server with pg_ctl start. At this point, if restart_after_crash is on, crash recovery (WAL replay) runs automatically, replaying transactions since the last checkpoint from WAL to restore a consistent state. As a permanent fix, you might add disk-usage monitoring alerts, ensure adequate capacity for the WAL archive destination, or mitigate an application bug that leaves connections idle in a transaction for too long using idle_in_transaction_session_timeout. Another typical case: "only a specific batch job fails with ERROR: out of shared memory." This is likely because a process acquiring locks across many tables/partitions simultaneously exceeded the max_locks_per_transaction × (expected connections) ceiling; consider splitting the batch or revisiting that parameter (a change that requires a restart). Recognizing that the wording of the error message itself is the shortest path to the culprit parameter speeds up triage even for unfamiliar failures.
| Parameter | Scope | Behavior on trigger |
|---|---|---|
| statement_timeout | Execution time of a single SQL statement | The statement is auto-canceled |
| lock_timeout | Wait time to acquire a lock | Aborts with an error |
| idle_in_transaction_session_timeout | Idle time while a transaction is open | The session is disconnected |
Trap: "statement_timeout also applies to waiting for a lock" is wrong—the lock-wait-specific limit is the separate parameter lock_timeout. Also, "setting synchronous_commit=off means no data can ever be lost" is wrong—off is a tradeoff for faster commit responses, and it accepts the risk that the most recent, not-yet-flushed transactions can be lost right after a crash. "Setting restart_after_crash to off prevents crashes from happening" is also wrong—it only controls whether the server auto-restarts after a crash, not whether a crash occurs in the first place.
4.1.3Section summary
- Triage failures from error messages (PANIC/FATAL/ERROR) and process/resource state (ps, df, free). PANIC is the most severe—a full crash plus automatic restart
- Distinguish statement_timeout (per statement), lock_timeout (lock waits), and idle_in_transaction_session_timeout (idle transactions). synchronous_commit/restart_after_crash govern crash resilience; pg_ctl controls startup; exceeding max_locks_per_transaction yields out of shared memory
Sign in to track progress — Log in.
Quick check
(just a quick review)Q1. The production server log shows "PANIC: could not write to file \"pg_wal/...\"" and immediately afterward the entire server process stops and restarts. Which statement about this situation is correct?
Q2. A particular batch job repeatedly gets stuck at the lock-wait stage for a long time, continuing to block other transactions. Which parameter would you set to cap the wait time for acquiring a lock and cut off this kind of prolonged blocking?
Q3. You are considering setting synchronous_commit to off to reduce commit-response latency. Which statement correctly describes the risk this change carries?
Keep track of your progress
The full study guide is free to read. Sign up free to practice with the question bank, track what you have read, review your mistakes, and highlight passages.