

What's changed: Initial version (topic G2)
2.4Additional Performance Monitoring Tools
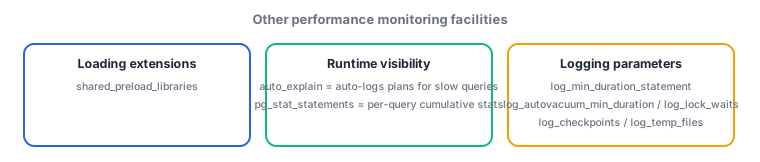
Learn additional server-wide and per-query monitoring tools: shared_preload_libraries, which loads extensions at server startup, auto_explain, which automatically logs execution plans, pg_stat_statements, which holds cumulative per-query statistics, and the logging parameters log_min_duration_statement, log_autovacuum_min_duration, log_lock_waits, log_checkpoints, and log_temp_files, which record slow queries, autovacuum activity, lock waits, checkpoints, and temp-file usage.
The pg_stat_* views and EXPLAIN covered so far monitor "sessions running right now" or "a single query." In practice, though, you also need continuous, cross-cutting monitoring—which queries have repeatedly been heavy over time, what the server log should capture. This section rounds that out.
2.4.1shared_preload_libraries, auto_explain, and pg_stat_statements
- shared_preload_libraries specifies which shared libraries (extensions) load at server startup. Extensions that must hook into the server continuously and globally—like
auto_explainandpg_stat_statements—can only be enabled by listing them here and restarting the server (note thatCREATE EXTENSIONalone is not sufficient for these). - auto_explain is an extension loaded via shared_preload_libraries. It automatically writes the execution plan of any query exceeding a set duration to the server log (the threshold is
auto_explain.log_min_duration; whether to include EXPLAIN ANALYZE-equivalent measurements is controlled byauto_explain.log_analyze). Its benefit is continuously capturing slow-query plans without manually running EXPLAIN each time. - pg_stat_statements is an extension loaded via shared_preload_libraries (
CREATE EXTENSION pg_stat_statementsalso creates its view). It accumulates, per normalized query string,calls(execution count),total_exec_time(total execution time),mean_exec_time(average execution time), androws(total row count) (in PostgreSQL 12 these columns aretotal_time/mean_time, renamed tototal_exec_time/mean_exec_timein 13). Its greatest value is ranking "which query is cumulatively the heaviest," complementing EXPLAIN (a single slow query) and pg_stat_activity (the current session).
2.4.2Logging-related parameters
- log_min_duration_statement logs any SQL statement exceeding a set number of milliseconds (
-1disables it,0logs every statement). Similar to auto_explain, but this is a lighter-weight approach that records only the SQL statement and its duration, not the execution plan. log_autovacuum_min_duration logs autovacuum runs exceeding a set duration (used to track how long autovacuum actually took). - log_lock_waits logs sessions whose lock wait exceeds deadlock_timeout (turning it on lets you discover "long lock waits" from the log itself—an after-the-fact tracking method that complements real-time investigation via pg_locks/pg_stat_activity). log_checkpoints logs each checkpoint's occurrence, duration, and number of buffers written (letting you trace signs of checkpoints firing too often or taking too long, from the log).
- log_temp_files logs temp-file usage exceeding a set size (detecting when a sort or hash operation exceeding
work_memspilled to disk as a temp file—a clue thatwork_memmay be undersized).
The staples: auto_explain and pg_stat_statements require registration in shared_preload_libraries plus a server restart (CREATE EXTENSION alone is not enough); auto_explain automatically logs slow-query execution plans, while log_min_duration_statement is a lighter-weight log of just the SQL statement and its duration; pg_stat_statements holds cumulative per-query statistics (total execution time, call count); log_lock_waits detects lock waits exceeding deadlock_timeout; log_temp_files hints at an undersized work_mem.
Let us lay out a practical workflow combining several monitoring tools. First, at server build time, set shared_preload_libraries = 'pg_stat_statements,auto_explain' in postgresql.conf and restart the server (running CREATE EXTENSION alone will not error, but these two extensions require a startup hook and simply will not function without it). For day-to-day "find the cumulatively heavy query" work, use pg_stat_statements: a query like SELECT query, calls, mean_exec_time, total_exec_time FROM pg_stat_statements ORDER BY total_exec_time DESC LIMIT 10; surfaces the top 10 by total execution time. The branching point for remediation is distinguishing whether mean_exec_time is low but calls is extremely high (a light query called enormously often, so total_exec_time piles up), versus calls being low but mean_exec_time high (each call is individually heavy). Once you find the latter kind of "individually heavy query," setting auto_explain.log_min_duration = 1000 (auto-logs the plan for any query over 1 second) means that the next time that query slows down again, its plan is already in the log—no manual EXPLAIN needed—dramatically speeding up after-the-fact investigation. At the broader stage of "not sure what's even happening," enable a combination of log_min_duration_statement = 500 (log any SQL statement over 0.5 seconds), log_lock_waits = on, log_checkpoints = on, and log_temp_files = 0 (log every temp file), and let it run for a while before surveying the logs. For example, if the log_temp_files log shows temp files recurring from a specific query, that is a sign that query's sort/hash exceeds work_mem, a cue to consider raising work_mem (G3 scope) or revisiting that query's indexing. Understanding the division of labor—pg_stat_statements is the tool for continuously finding "what is heavy," while auto_explain and the various log parameters are for confirming "what happened" after the fact—removes ambiguity both on the exam and in practice.
| Item | What it records | Enabling it |
|---|---|---|
| pg_stat_statements | Cumulative per-query stats (calls/total_exec_time/etc.) | shared_preload_libraries + restart + CREATE EXTENSION |
| auto_explain | Auto-logs slow-query execution plans | shared_preload_libraries + restart |
| log_min_duration_statement | Slow SQL statement + duration (lightweight) | postgresql.conf parameter change (reloadable) |
| log_lock_waits | Lock waits exceeding deadlock_timeout | postgresql.conf parameter change (reloadable) |
Trap: "pg_stat_statements can be enabled just by running CREATE EXTENSION" is wrong—you must first register it in shared_preload_libraries and restart the server; skipping this step means CREATE EXTENSION itself will not error, but the extension will not function correctly. Also, "auto_explain and log_min_duration_statement record the same information" is wrong—auto_explain records the execution plan itself, while log_min_duration_statement records only the SQL statement and its duration, two different levels of detail.
2.4.3Section summary
- shared_preload_libraries = loaded at server startup (auto_explain/pg_stat_statements require registration + restart). pg_stat_statements = cumulative per-query stats; auto_explain = auto-logs slow-query plans
- log_min_duration_statement = slow SQL statements (lightweight); log_autovacuum_min_duration = slow autovacuum runs; log_lock_waits = detect lock waits; log_checkpoints = record checkpoints; log_temp_files = temp-file usage (hints at undersized work_mem)
Sign in to track progress — Log in.
Quick check
(just a quick review)Q1. You ran CREATE EXTENSION pg_stat_statements; to enable the extension, but statistics are not accumulating correctly. What is the most likely cause?
Q2. You want the execution plan of a query automatically recorded in the server log whenever it runs slowly, without manually running EXPLAIN each time. Which extension should you configure?
Q3. Checking the server log (with log_temp_files enabled) shows frequent temp-file creation tied to a specific query. What remedy does this signal most appropriately suggest?
Keep track of your progress
The full study guide is free to read. Sign up free to practice with the question bank, track what you have read, review your mistakes, and highlight passages.