

What's changed: Initial version (topic G2)
2.2Table and Column Statistics
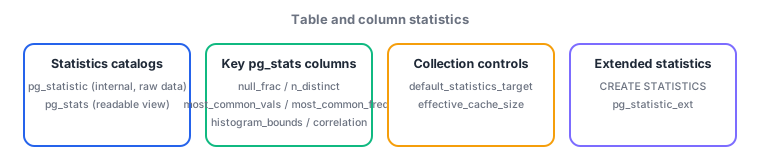
Learn pg_statistic/pg_stats, the basis on which the planner chooses execution plans: what per-column null_frac, n_distinct, most_common_vals, most_common_freqs, histogram_bounds, and correlation mean; default_statistics_target, which controls statistics precision; effective_cache_size, used to estimate cache size; and extended statistics (CREATE STATISTICS, pg_statistic_ext) for capturing multi-column correlation.
Rather than knowing result row counts by actually running a query, PostgreSQL's planner takes the approach of estimating from statistics previously collected by ANALYZE. Because this estimate's accuracy directly shapes plan quality, understanding how statistics are stored per column and what governs their precision is prerequisite knowledge before reading EXPLAIN output.
2.2.1pg_statistic and pg_stats
- pg_statistic is the system catalog storing the raw statistics collected by ANALYZE. Its columns are stored as typed arrays (like
stanullfrac) and are hard to read directly, so in practice you consult pg_stats (a view), which presents the data readably. Only the table owner or a role with sufficient privilege can see every column in pg_stats. - null_frac is the fraction of rows where the column is NULL. n_distinct is the estimated number of distinct values (a positive value = an absolute count; a negative value = a ratio to the row count—e.g.,
-0.5means "half the rows are unique values," and columns close to a primary key approach -1). - most_common_vals (MCV) is a list of frequently occurring values, paired with most_common_freqs, their respective frequencies. For a query like
WHERE col = constant, if that constant appears in the MCV list the planner uses its recorded frequency directly; otherwise it estimates from the remaining distribution. histogram_bounds gives the equi-frequency histogram boundaries describing the distribution of values not in the MCV list (used to estimate selectivity for range predicates likeWHERE col > constant). correlation measures the correlation between a column's value order and its physical storage order (-1 to 1; the closer to 1, the more physical order matches sort order, which favors Index Scan since disk reads stay sequential too).
2.2.2Statistics precision and extended statistics
- default_statistics_target controls the level of detail (default 100) ANALYZE collects per column for the MCV list and histogram. Raising it increases the number of MCV entries and histogram buckets, improving estimate accuracy at the cost of a more expensive ANALYZE and a larger pg_statistic. It can also be overridden per column with
ALTER TABLE ... ALTER COLUMN ... SET STATISTICS n. - effective_cache_size tells the planner an estimate of the total effectively usable cache, including the OS filesystem cache (it does not actually allocate memory). The larger this value, the more the planner assumes "the data is likely already cached," making it more inclined to favor Index Scan.
- Extended statistics is the mechanism for explicitly registering correlations between multiple columns that a single-column statistic cannot capture (e.g., a prefecture-city relationship where fixing one skews the other's distribution). You create it with the CREATE STATISTICS statement, specifying the target columns and kind (functional dependencies/ndistinct/mcv); the definition is registered in the pg_statistic_ext catalog, and after ANALYZE the actual data is stored in pg_statistic_ext_data (viewable via the readable pg_stats_ext). It exists to correct estimation errors caused by the independence assumption when correlation is ignored.
The staples: a negative n_distinct is a ratio to row count (near -1 for near-primary-key columns); most_common_vals/most_common_freqs are paired arrays; correlation near 1 favors Index Scan; raising default_statistics_target improves accuracy but also raises ANALYZE cost; multi-column correlation is only captured by creating extended statistics via CREATE STATISTICS. The role split—pg_statistic holds raw data, pg_stats is the readable view—recurs often.
Let us trace how coarse statistics translate into real harm. A typical complaint: a large orders table where the status column has only three values (pending/shipped/cancelled), yet the plan unexpectedly chooses Seq Scan. Checking SELECT * FROM pg_stats WHERE tablename='orders' AND attname='status';, if most_common_vals holds all three values with plausible most_common_freqs, the planner's estimate itself is accurate, and if WHERE status = 'pending' matches, say, 40% of rows, a Seq Scan being faster than using an index is likely the correct call. Conversely, if statistics are stale (last_analyze was weeks ago) so the MCV ratios drift from reality, the first remedy is simply to re-run ANALYZE orders;. For columns where accuracy still falls short even after that (few distinct values but heavily skewed distribution, or extremely high cardinality), you can raise resolution by overriding default_statistics_target per column—ALTER TABLE orders ALTER COLUMN customer_id SET STATISTICS 500;—then re-running ANALYZE, boosting the histogram/MCV resolution. Furthermore, for queries whose WHERE clause combines two columns that are logically strongly correlated, like customer_id and region, single-column statistics alone tend to over- or under-estimate "rows matching both conditions." Creating extended statistics with CREATE STATISTICS orders_cust_region_stat (dependencies) ON customer_id, region FROM orders;, then letting it populate pg_statistic_ext after ANALYZE, raises estimate accuracy for WHERE clauses combining multiple conditions. "First suspect the statistics, then run ANALYZE, and only then raise precision itself if that's still not enough" is the standard staged approach in practice.
| Item | Meaning | Use |
|---|---|---|
| null_frac | Fraction of rows that are NULL | Selectivity estimate for IS NULL predicates |
| n_distinct | Estimated distinct count (negative = ratio) | Cardinality estimation |
| most_common_vals/freqs | Frequent values paired with frequencies | Selectivity estimate for equality predicates |
| histogram_bounds | Equi-frequency histogram boundaries | Selectivity estimate for range predicates |
| correlation | Correlation between physical and sort order (-1 to 1) | Judging how favorable an Index Scan is |
Trap: "n_distinct is always a positive absolute count" is wrong—a negative value represents a ratio to the row count, approaching -1 for columns near a primary key or unique constraint. Also, "raising default_statistics_target automatically captures cross-column correlation" is wrong—default_statistics_target governs single-column precision; capturing correlation between columns requires explicitly creating extended statistics via CREATE STATISTICS.
2.2.3Section summary
- pg_statistic = raw data, pg_stats = the readable view. null_frac / n_distinct (negative = ratio) / most_common_vals + freqs / histogram_bounds / correlation together determine the planner's estimate
- default_statistics_target = statistics detail level (overridable per column); effective_cache_size = cache size estimate; multi-column correlation needs extended statistics via CREATE STATISTICS (pg_statistic_ext)
Sign in to track progress — Log in.
Quick check
(just a quick review)Q1. pg_stats shows n_distinct as -0.98 for the customer_id column. What is the correct interpretation of this value?
Q2. A query on the orders table filtering on both customer_id and region has a row-count estimate far off from reality, and the two columns have a strong logical correlation. What is the best remedy?
Q3. A heavily skewed column has large selectivity-estimate errors under the default ANALYZE precision. You are willing to accept a higher ANALYZE cost to improve accuracy for just this column. What is the appropriate approach?
Keep track of your progress
The full study guide is free to read. Sign up free to practice with the question bank, track what you have read, review your mistakes, and highlight passages.