

What's changed: Added §4.4 "Microsoft Fabric (Unified Analytics Platform)" to fix the drift from the 2026 refresh that centers the analytics domain on Fabric/OneLake/lakehouse/Real-Time Intelligence/Data Activator. Adds Fabric alongside the existing Synapse-centric content
4.3Power BI and Batch vs. Stream Processing
Understand data visualization with Microsoft Power BI (reports/dashboards) and the difference between batch and stream processing.
The final analytics stage is "present." Microsoft Power BI turns data into reports and dashboards anyone can understand.
4.3.1Visualization with Power BI
Power BI has parts with distinct roles. Power BI Desktop (a free authoring tool) ingests, transforms, and designs reports. You publish to the Power BI service (cloud) to share/publish, and view on Power BI Mobile. Note the split: who authors, who views, and where it is distributed.
- Reports: multi-page, interactive analysis combining charts and tables, with filters and drill-down.
- Dashboards: a single-screen view collecting key metrics (tiles) from multiple reports—good for an overview.
- Author in Power BI Desktop, share/publish via the Power BI service, view in Power BI Mobile.
Report vs dashboard: a report is multi-page on one dataset for deep interactive analysis; a dashboard is a single page collecting key tiles from multiple reports for a summary. "Analyze in depth = report," "see at a glance = dashboard."
4.3.2Batch vs. stream processing
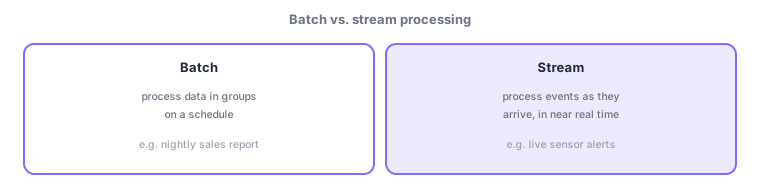
- Batch processing: process data in groups on a schedule; tolerates latency but handles large volumes efficiently. E.g., nightly aggregation.
- Stream processing: process events as they arrive, near real time; for low-latency needs. E.g., sensor alerts, fraud detection.
| Aspect | Batch | Stream |
|---|---|---|
| Unit | Large grouped data | Individual events |
| Timing | Scheduled (periodic) | On arrival (immediate) |
| Latency | Higher acceptable | Low latency needed |
| Example | Nightly sales rollup | Real-time alerts |
Scenario: factory operations monitoring. Temperature/vibration sensor data needs instant anomaly detection → stream processing (Stream Analytics) judges immediately and alerts on threshold breaches. Meanwhile, a "daily utilization report" rolling up a day’s logs is computed nightly via batch processing, shown in a Power BI dashboard for the plant manager to grasp at a glance, with reports for drill-down. Choose processing by immediacy, visualization format by needed depth.
Q. Report or dashboard? A report for deep interactive analysis; a dashboard to grasp key points at a glance. Q. Are batch and stream exclusive? No—most platforms use both (e.g., real-time alerts via stream, monthly rollups via batch). Q. Which Azure service for streaming? Stream Analytics (previous section) processes continuously arriving data immediately.
Common points: visualization/reports/dashboards = Power BI, and batch (grouped/scheduled, latency OK) vs stream (real time, low latency). "Nightly report" = batch; "real-time alerts" = stream. Report = multi-page deep analysis / dashboard = single-screen summary.
4.3.3Section summary
- Power BI = visualize via reports/dashboards
- Batch (grouped/scheduled) / stream (real time)
Sign in to track progress — Log in.
Quick check
(just a quick review)Q1. Which Microsoft service visualizes and shares data as reports and dashboards?
Q2. Which processing style aggregates the day’s data together at a fixed nightly time?
Q3. Which style processes sensor data near real time as each event arrives?
Keep track of your progress
The full study guide is free to read. Sign up free to practice with the question bank, track what you have read, review your mistakes, and highlight passages.