

What's changed: Deepened DP-700 Chapter 3 (ja figures; comparison tables/scenarios/FAQ/traps/deep paragraphs in all sections)
3.1Monitoring and Error Handling
Understand tracking runs via the Fabric Monitoring hub, error handling and retries for pipelines/notebooks, and capacity monitoring with the Capacity Metrics app. Find issues early and operate stably.
Data processing can fail, so you must monitor runs and handle failures. Fabric surfaces status via the Monitoring hub and Capacity Metrics.
3.1.1Monitoring and error handling
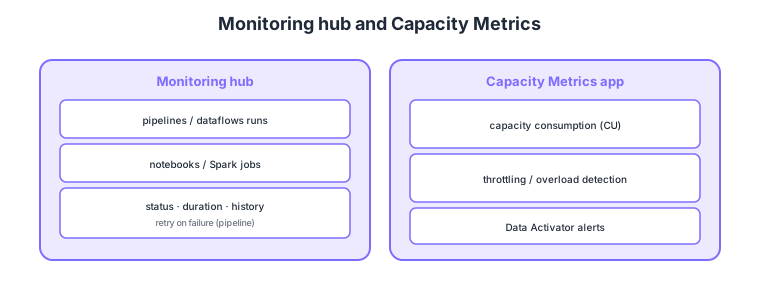
- Monitoring hub: centrally view run history, status, and duration for pipelines/dataflows/notebooks/Spark.
- Error handling: handle via pipeline retry policies and success/failure-branching activities.
- Capacity Metrics app: visualize capacity consumption (CU) and throttling to detect overload.
- Alerts (Data Activator): trigger notifications/actions automatically based on data conditions.
Common on DP-700: central run history/status = Monitoring hub, retry on failure = pipeline retry policy, capacity consumption/throttling = Capacity Metrics app, data-condition alerts = Data Activator. Start by monitoring to understand status.
Because capacity is shared, one workload over-consuming can throttle others; use Capacity Metrics to find the source.
The Monitoring hub lists run history, status, and duration for pipelines/dataflows/notebooks/Spark/semantic-model refreshes across the tenant, with drill-down into individual runs. Handle errors with pipeline retry policies (count, interval) and per-activity success/failure/completion/skip dependencies, using a failure path for notifications/cleanup; retry transient errors, fix permanent ones after checking logs. The Capacity Metrics app shows capacity unit (CU) consumption over time, visualizing smoothing (leveling short bursts) and throttling (delay/reject on overage) and pinpointing the source of over-consumption (which item/operation). Data Activator detects data/event conditions (e.g., threshold breaches) and triggers notifications or actions. Dig deeper with the Spark UI/app logs and Warehouse query analysis. Summary: “run status = Monitoring hub,” “capacity health = Capacity Metrics,” “auto-react to data conditions = Data Activator.”
| Goal | Tool | Example |
|---|---|---|
| See run status/history | Monitoring hub | Find a failed pipeline run |
| See capacity health | Capacity Metrics app | Check CU consumption and throttling |
| Auto-retry failures | Retry policy | Auto-retry transient errors |
| Alert on data conditions | Data Activator | Email/Teams on threshold breach |
Scenario: a nightly pipeline fails intermittently and a heavy step consumes capacity, throttling others. → First find the failed runs in the Monitoring hub and set a retry policy for transient errors. Use the Capacity Metrics app to locate CU spikes and their source (e.g., a heavy Spark job), then level it by spreading schedules or revisiting capacity.
FAQ: Q. Monitoring hub vs Capacity Metrics? → A. Monitoring hub = per-run status/history; Capacity Metrics = capacity (CU) consumption and throttling. Different roles, used together. Q. When throttled? → A. Find the source and spread load, or revisit capacity (SKU); smoothing absorbs short bursts.
Trap: “use the Monitoring hub to find capacity throttling causes” is wrong—capacity (CU) consumption/throttling is the Capacity Metrics app; the Monitoring hub shows per-run status/history. Also “a retry policy will always resolve permanent errors” is wrong—permanent failures need log review + fixes; retries are for transient errors.
3.1.2Section summary
- Monitoring = Monitoring hub + Capacity Metrics app
- Handling = retry policies, Data Activator alerts
Sign in to track progress — Log in.
Quick check
(just a quick review)Q1. You want to centrally view run history/status/duration for pipelines/notebooks. What in Fabric?
Q2. You want to visualize capacity consumption (CU)/throttling and find overload causes. What do you use?
Q3. A pipeline activity fails on transient errors. What setting do you consider first?
Keep track of your progress
The full study guide is free to read. Sign up free to practice with the question bank, track what you have read, review your mistakes, and highlight passages.