

What's changed: Deepened DP-600 Chapter 3 (ja figures; comparison tables/scenarios/FAQ/traps/deep paragraphs in all sections)
3.2Exploring and Analyzing Data
Understand ways to explore/analyze data—DAX queries, T-SQL, KQL, Power BI visual exploration, and performance troubleshooting (Performance Analyzer, DAX Studio).
After modeling, you explore/analyze data with queries and visuals, choosing DAX/T-SQL/KQL by use, and diagnosing slowness when needed.
3.2.1Explore, analyze, and tune
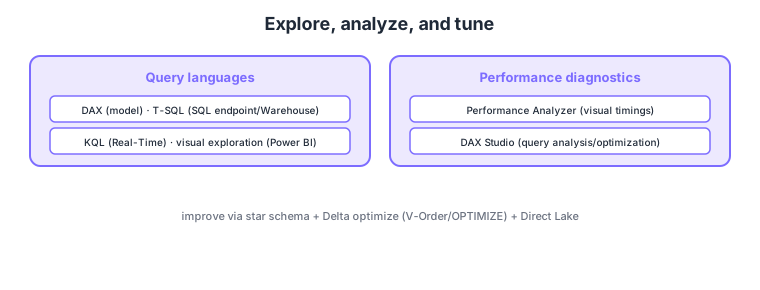
- Choosing query languages: DAX (model), T-SQL (SQL endpoint/Warehouse), KQL (Real-Time).
- Visual exploration: analyze interactively in Power BI with charts/slicers/drilldown.
- Performance Analyzer: measures per-visual timings in a report to find slow spots.
- DAX Studio, etc.: analyze/optimize DAX queries and isolate storage vs formula engine issues.
Common on DP-600: model calc/query = DAX, SQL analysis = T-SQL (SQL analytics endpoint), streaming = KQL, visual slowness diagnosis = Performance Analyzer, DAX optimization = DAX Studio. For slow reports, measure with Performance Analyzer first.
Performance issues are improved by a mix of model design (star schema/measures), Delta optimization (V-Order/OPTIMIZE), and storage mode (Direct Lake).
Choose query languages by purpose: DAX for model aggregations (EVALUATE for DAX queries), T-SQL (SQL analytics endpoint) for tabular analysis of Lakehouse/Warehouse, and KQL (Real-Time Intelligence/Eventhouse) for streaming/logs. For ad-hoc work, Power BI’s visual exploration (slicers, drilldown, “Analyze” AI) and quick measures help. To troubleshoot performance, first measure per-visual DAX query time / visual display / other with Performance Analyzer, analyze slow DAX with DAX Studio/Tabular Editor (Best Practice Analyzer), and inspect the storage engine (VertiPaq, fast) vs formula engine (single-threaded, often slow) ratio. Also check whether Direct Lake fallback occurred. Root fixes: “adopt a star schema,” “revise measures (avoid abusing iterators/bidirectional),” “V-Order/OPTIMIZE the Delta,” and “drop unneeded/high-cardinality columns.” The rule is “measure first → identify cause (model/DAX/data layout) → improve.”
| Goal | Language/tool | Target |
|---|---|---|
| Model aggregation | DAX | Semantic model |
| Tabular SQL analysis | T-SQL | SQL endpoint/Warehouse |
| Streaming/logs | KQL | Real-Time (Eventhouse) |
| Diagnose slowness | Performance Analyzer / DAX Studio | Reports/DAX queries |
Scenario: a report page is slow; find the cause and fix it. → First measure per-visual DAX query times with Performance Analyzer to find the slowest visual. Analyze its DAX in DAX Studio; if you find formula-engine heaviness or iterator abuse, rewrite the measure, star-ize the model, and V-Order/OPTIMIZE the Delta to improve.
FAQ: Q. DAX vs T-SQL vs KQL? → A. DAX for model aggregations, T-SQL (SQL analytics endpoint) for SQL tabular analysis, KQL for streaming/logs. Q. First step for a slow report? → A. Measure with Performance Analyzer to pinpoint the bottleneck (which visual/DAX), then dig in with DAX Studio, etc.
Trap: “deleting relationships speeds up the report” is wrong—removing relationships breaks the model; improve via star schema, measure revision, Delta optimization, Direct Lake. Also “use DAX to analyze streaming data” is wrong—real-time/logs use KQL.
3.2.2Section summary
- Explore = DAX/T-SQL/KQL + visuals
- Diagnose = Performance Analyzer, DAX Studio
Sign in to track progress — Log in.
Quick check
(just a quick review)Q1. You want to measure per-visual timings in a Power BI report to find slow spots. What do you use?
Q2. Which language queries streaming/real-time data?
Q3. Which is NOT effective for improving a slow report?
Keep track of your progress
The full study guide is free to read. Sign up free to practice with the question bank, track what you have read, review your mistakes, and highlight passages.