

What's changed: Deepened DP-300 Chapter 3 (ja figures; comparison tables/scenarios/FAQ/traps/deep paragraphs in all sections)
3.1Monitoring and Performance Visibility
Understand monitoring Azure SQL—metrics (DTU/CPU/IO), Azure Monitor / Log Analytics, Query Store, and dynamic management views (DMVs)—to find performance bottlenecks.
Optimization starts with measurement (what is slow). Azure SQL surfaces performance via metrics, Query Store, and DMVs.
3.1.1Monitoring tools
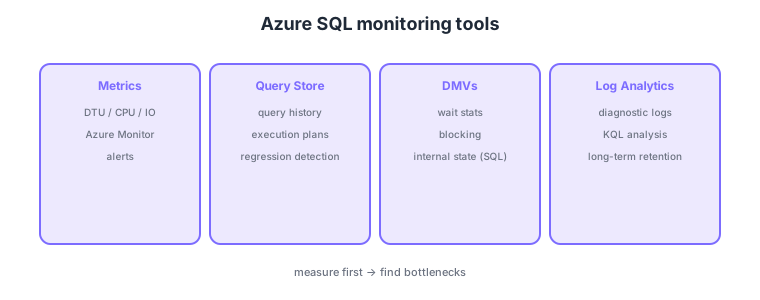
- Metrics: visualize DTU/CPU/IO utilization in Azure Monitor and alert on thresholds.
- Query Store: records query history and execution plans for regression detection.
- DMVs: query internal state like wait stats and blocking via SQL.
- Diagnostic logs: send to Log Analytics for KQL analysis and long-term retention.
Common on DP-300: query history/plans/regression = Query Store, DTU/CPU/IO visualization and alerts = metrics + Azure Monitor, wait stats/blocking = DMVs, KQL log analysis = Log Analytics. Measure first to find bottlenecks.
To find regressions, use Query Store to locate queries that "used to be fast but slowed down" and compare plan changes.
Monitor both “resources” and “queries.” On the resource side, visualize metrics (DTU%, CPU%, data/log IO, workers/sessions, deadlocks) in Azure Monitor, with threshold alerts + action groups for notification; send diagnostic logs (QueryStoreRuntimeStatistics, Errors, Blocks) to Log Analytics via diagnostic settings and dig in with KQL. On the query side, Query Store keeps execution plans, runtime statistics, and wait stats inside the database, surfacing “regressed queries” and “top resource consumers,” and you can stabilize with plan forcing. For real-time internal state, use DMVs (sys.dm_exec_requests, sys.dm_os_wait_stats, sys.dm_db_index_usage_stats, etc.), isolating CPU/IO/lock contention from wait types. Portal features like Intelligent Insights and Database/Query Performance Insight auto-highlight key points. The rule is “measure first → identify cause (waits/plan/index) → improve.”
| What you want | Tool | Example |
|---|---|---|
| Resource trends/alerts | Metrics + Azure Monitor | DTU%/CPU% threshold alerts |
| Query history/plan/regression | Query Store | Compare plans of slowed queries |
| Live internal state | DMVs | Wait stats, blocking chains |
| Cross-log analysis/retention | Log Analytics (KQL) | Aggregate diagnostic logs in KQL |
Scenario: “a report that was fast until last week is suddenly slow.” → Open the query’s plan history in Query Store and pinpoint when the plan changed. Stabilize immediately by plan forcing the good plan, then confirm the root cause (stale statistics or missing index) via DMVs/execution plan for a permanent fix.
FAQ: Q. Query Store vs DMVs? → A. Query Store is for historical/plan/regression analysis over time; DMVs are for live, point-in-time state (waits, blocking). Q. What are wait stats for? → A. They show where time is spent waiting (CPU/IO/locks), helping classify the bottleneck.
Trap: “use DMVs to analyze how a query’s plan changed over time” is wrong—historical plan/regression analysis is Query Store; DMVs are point-in-time (some reset on restart). Also “high CPU always means missing indexes” is wrong—use wait stats to distinguish IO/locks, etc.
3.1.2Section summary
- Monitoring = metrics/Azure Monitor, Query Store, DMVs, Log Analytics
- Measure first to find bottlenecks
Sign in to track progress — Log in.
Quick check
(just a quick review)Q1. Which Azure SQL feature records query history/plans and helps identify performance regressions?
Q2. You want to visualize DTU/CPU/IO utilization and alert on thresholds. What do you use?
Q3. You want to query internal DB state like wait stats and blocking via SQL. What do you use?
Keep track of your progress
The full study guide is free to read. Sign up free to practice with the question bank, track what you have read, review your mistakes, and highlight passages.