

What's changed: In-scope coverage: ops platform (ECS/EKS/CloudFormation/CDK/CLI/Code trio/SSM/Managed Grafana/Well-Architected/Cost Explorer/Budgets) + data-prep/ML (Glue DataBrew/SageMaker AI/Bedrock/Kendra)
3.2Analysis and Visualization
Understand turning data into value: SQL analytics with Athena/Redshift, BI dashboards with Amazon QuickSight, and log/search analytics with OpenSearch.
Stored data becomes valuable only when analyzed and visualized. Query with Athena/Redshift, visualize with QuickSight, and do log/search analytics with OpenSearch.
3.2.1Analyze, visualize, and search
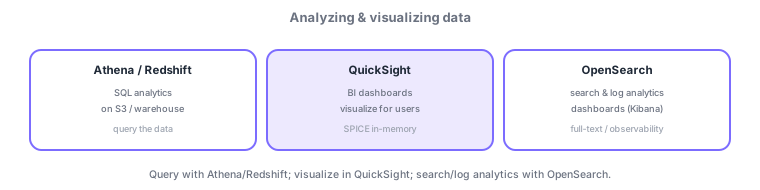
- Athena/Redshift: analyze data with SQL (serverless S3 query / large DWH).
- Amazon QuickSight: visualize data in BI dashboards for business users (fast via SPICE).
- OpenSearch Service: strong for log analytics and full-text search, with dashboards (Kibana).
Common on DEA: business BI dashboards = QuickSight, log analytics/full-text search = OpenSearch, ad-hoc SQL on S3 = Athena. Don’t swap the roles of visualization and analysis.
Separate "analysis (query)," "visualization (dashboards)," and "search/log analytics." Query with Athena (serverless SQL on S3, billed per scan) or Redshift (large DWH). Visualize with Amazon QuickSight, sharing BI dashboards with business users; loading into SPICE (in-memory) speeds responses and offloads the source (with row/column-level security, natural-language Q, and embedding). For search and log analytics/observability, Amazon OpenSearch Service excels, visualized in OpenSearch Dashboards (Kibana). Chain the layers—"QuickSight uses Athena/Redshift/RDS as data sources," "ship logs into OpenSearch to search." The axes: "standardized business BI = QuickSight," "ad-hoc exploratory SQL = Athena," "full-text/log observability = OpenSearch." A common trap is swapping the visualization tool (QuickSight) with the analysis engine (Athena/Redshift).
| Goal | Use |
|---|---|
| Business BI dashboards | QuickSight (SPICE) |
| Ad-hoc SQL on S3 | Athena |
| Steady large-scale analytics | Redshift |
| Full-text/log analytics | OpenSearch Service |
Scenario: build a revenue dashboard for execs and a log-investigation platform for SREs. Use Redshift (or S3 + Athena) as a QuickSight data source, accelerate with SPICE, and segment by department with row-level security. Aggregate app/infra logs in OpenSearch and provide full-text search and observability dashboards via Kibana.
Q. Business BI dashboards? QuickSight. Q. Log analytics/full-text search? OpenSearch. Q. Ad-hoc SQL on S3? Athena. Q. Faster dashboards? Load into SPICE. Q. Segment by department? QuickSight row/column-level security.
Watch the mix-ups: (1) QuickSight visualizes; Athena/Redshift are the analysis engines—don’t swap (QuickSight alone isn’t a query engine). (2) OpenSearch is for full-text/logs, not the lead for large aggregation analytics (that’s Redshift). (3) SPICE has capacity limits—use direct query for very large data.
Loading data into QuickSight’s SPICE (in-memory engine) speeds dashboards and reduces load on the source.
3.2.2In-scope services for data prep, ML, and search
Before and after analysis, data-prep and machine-learning services are also tested. AWS Glue DataBrew cleans and normalizes data (250+ transforms) via a visual, no-code interface, speeding data preparation. To run ML on prepared features, Amazon SageMaker AI is a platform integrating data prep, training, deployment, and inference, bridging data engineering and ML via feature store and pipelines. To embed generative AI in a pipeline, Amazon Bedrock provides multi-provider foundation models via one serverless API, invocable from Lambda/Step Functions to summarize or classify extracted data. For natural-language search (question answering) over internal documents, use ML-powered Amazon Kendra, keeping its role distinct from SQL analytics on structured data (Athena) and full-text/log search (OpenSearch).
3.2.3Section summary
- Athena/Redshift (analyze) / QuickSight (visualize) / OpenSearch (search·logs)
- BI dashboards = QuickSight; full-text/logs = OpenSearch
- Data prep = Glue DataBrew; ML = SageMaker AI; gen-AI = Bedrock; enterprise search = Kendra
Sign in to track progress — Log in.
Quick check
(just a quick review)Q1. You want interactive BI dashboards to visualize data for business users. Which fits best?
Q2. Which service best fits full-text log search and observability analytics/dashboards?
Q3. You want serverless ad-hoc SQL queries on S3 data. Which fits best?
Keep track of your progress
The full study guide is free to read. Sign up free to practice with the question bank, track what you have read, review your mistakes, and highlight passages.