

What's changed: Deepened AZ-400 Chapter 5 (added comparison tables, scenarios, FAQs, exam traps, deep-dive paragraphs to each section; localized figures to Japanese)
5.1Designing Logging and Metrics
Understand observability foundations—Azure Monitor, Log Analytics (KQL), metrics, distributed tracing, and structured logs. Aggregate telemetry and make system state visible.
The final DevOps pillar is instrumentation. Aggregate logs, metrics, and traces to make state visible.
5.1.1Aggregating telemetry
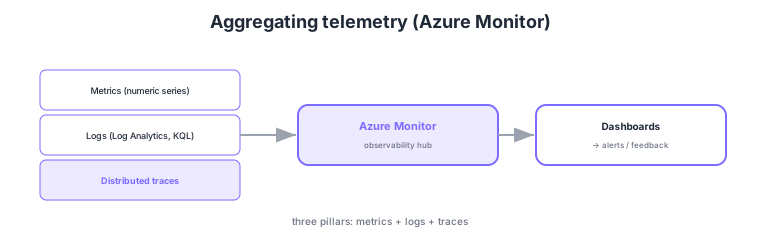
- Azure Monitor: the observability hub aggregating metrics/logs/traces.
- Log Analytics: a workspace aggregating logs, analyzed with KQL.
- Metrics: numeric time series; the basis for threshold monitoring and autoscale.
- Structured logs/traces: searchable structured logs and distributed traces across services for root cause.
Common on AZ-400: monitoring hub = Azure Monitor, log aggregation + KQL = Log Analytics, numeric time series = metrics, cross-service latency tracing = distributed traces. Integrating the three pillars (metrics/logs/traces) speeds root-cause analysis.
AZ-400 instrumentation probes "what to measure, where to aggregate, and how to make it analyzable." The three pillars of observability are metrics (numeric time series like CPU/latency/error rate, the basis for threshold alerts and autoscale), logs (event records; making them structured eases KQL search/aggregation), and traces (distributed traces showing how a request flows across services and where it slowed). Azure Monitor is the hub aggregating these; each resource’s diagnostic settings route platform logs/metrics to a Log Analytics workspace (cross-cutting KQL analysis), storage (long-term retention), or Event Hubs (SIEM). Instrument apps with Application Insights (below) or OpenTelemetry (vendor-neutral instrumentation exporting to Azure Monitor), propagating a correlation ID (trace ID) to tie logs, traces, and metrics together. Design topics include workspace aggregation (centralized/distributed), retention and cost, sampling, structured logging discipline, and ID propagation for correlation. Measurement rests on the DevOps premise "you can’t improve what you can’t measure," forming the foundation for downstream alerts/SRE/feedback. The key is to aggregate the three pillars into Azure Monitor/Log Analytics and build observability that "reaches the cause" via structure and correlation.
| Pillar | What | Use |
|---|---|---|
| Metrics | Numeric time series | Threshold alerts; autoscale |
| Logs | Event records (prefer structured) | KQL analysis in Log Analytics |
| Traces | Cross-service path and latency | Bottleneck/root-cause |
| Aggregation | Azure Monitor / Log Analytics | Basis for dashboards/alerts |
Scenario: In a microservice setup, isolating production-incident causes takes too long. Strengthen observability. → Instrument each service with OpenTelemetry/Application Insights, propagating a correlation ID (trace ID). Aggregate the three pillars in Azure Monitor, send structured logs to Log Analytics for cross-cutting KQL. Alert on metrics, pinpoint latency via traces, and confirm details in logs—shortening MTTR. Use a centralized workspace for easy cross-cutting queries.
FAQ: Metrics vs logs? Metrics are numeric time series—aggregated, low-cost, fast—good for threshold alerts, autoscale, and trend analysis. Logs are detailed records of individual events—good for deep root-cause and audit (powerful with structure + KQL). Use metrics to "notice anomalies" and logs + traces to "investigate why," linked by a correlation ID.
Exam trap: Platform logs do not flow to Log Analytics unless diagnostic settings are configured (not sent by default). Also, collecting everything with high-frequency metrics and unsampled full logs balloons cost—design retention, sampling, and destinations (Log Analytics for analysis, cheap storage for long-term). In-app performance/exceptions are handled by Application Insights (APM), not Log Analytics alone.
5.1.2Section summary
- Aggregation = Azure Monitor + Log Analytics (KQL)
- Three pillars = metrics/logs/traces
Sign in to track progress — Log in.
Quick check
(just a quick review)Q1. Aggregate logs from many services in one place and analyze with KQL. What?
Q2. Which Azure service is the central hub aggregating metrics, logs, and traces?
Q3. Trace where requests slow down across microservices. What?
Keep track of your progress
The full study guide is free to read. Sign up free to practice with the question bank, track what you have read, review your mistakes, and highlight passages.