

What's changed: Deepened AZ-204 Chapter 4 to Associate depth (tables, scenarios, FAQ, traps; localized figures)
4.1Monitoring with Application Insights
Understand monitoring: telemetry collection with Application Insights (requests, dependencies, exceptions, custom metrics), KQL analysis, the application map, and alerts. The starting point for "Monitor, troubleshoot, and optimize" in AZ-204.
To understand app performance and failures, collect/analyze telemetry with Application Insights (part of Azure Monitor). It speeds up problem identification and alerting.
4.1.1Collect, analyze, alert
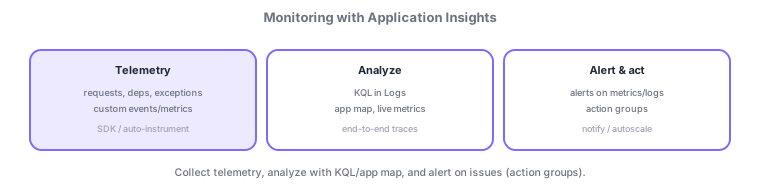
- Telemetry: collect requests, dependencies, exceptions, custom events/metrics (SDK or auto-instrumentation).
- Analyze: query Logs with KQL, visualize dependencies/latency with the application map, watch live metrics.
- Alerts: fire on metric/log conditions; action groups notify or autoscale.
- Distributed tracing: follow end-to-end flow across services via correlation IDs.
Common on AZ-204: app performance/exception monitoring = Application Insights, query logs = KQL, find cross-service latency = app map/distributed tracing, notify/auto-respond on conditions = alerts + action groups.
Continue reading — free sign-up
You're reading the free preview. Sign up free to read this section in full, plus every chapter (including 4+) and all questions.