

What's changed: Deepened SOA-C02 Chapter 1 to Associate depth (tables, scenarios, FAQ, traps; localized figures)
1.1CloudWatch Metrics and Alarms
Understand monitoring ops: CloudWatch metrics, alarm states (OK/ALARM/INSUFFICIENT_DATA) and thresholds, actions (SNS notify, Auto Scaling, EC2 action), and in-guest metrics via the CloudWatch agent. The starting point for "Monitoring, Logging, and Remediation" in SOA-C02.
A SysOps admin’s first job is to always know system state. Amazon CloudWatch collects metrics and detects anomalies with alarms.
1.1.1Metrics and alarms
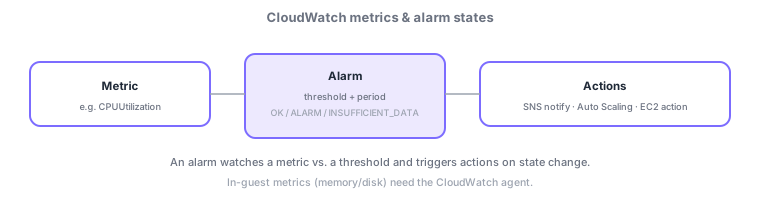
- Metrics: numeric time-series like CPU usage; many are collected by default for EC2, etc.
- Alarm: has states OK / ALARM / INSUFFICIENT_DATA based on a threshold and evaluation period.
- Actions: on state change, trigger SNS notification, Auto Scaling, EC2 reboot/stop, etc.
- CloudWatch agent: in-guest metrics like memory and disk require installing the agent (not collected by default).
Common on SOA: memory/disk usage = CloudWatch agent required, the three alarm states, INSUFFICIENT_DATA = not enough data, alarm → SNS/Auto Scaling/EC2 action.
The most-tested SOA-C02 point is "what’s collected by default vs. what needs the agent." EC2 collects CPU, network, and disk I/O from the hypervisor by default, but memory usage and disk free space are inside the guest OS, so they aren’t collected by default and require the CloudWatch agent. Collection interval: basic monitoring = 5 minutes, detailed monitoring = 1 minute (extra cost); high-resolution metrics go down to 1 second. An alarm uses a threshold and an evaluation period (M of N datapoints) to hold three states—OK / ALARM / INSUFFICIENT_DATA—where INSUFFICIENT_DATA means not enough data (not necessarily a fault). You can also configure missing-data treatment (notBreaching/breaching/ignore/missing). On state change, notify via SNS (email/Slack) or trigger an Auto Scaling action or EC2 action (reboot/stop/terminate/recover).
| Metric | Default? | Note |
|---|---|---|
| CPU / network | Yes | From the hypervisor |
| Memory usage | No | Requires the agent |
| Disk free space | No | Requires the agent |
| Interval | 5 min / 1 min | Detailed = 1 min |
Scenario: monitor an EC2 that dies under memory pressure. Memory isn’t collected by default, so install the CloudWatch agent to send memory usage. An alarm (e.g., 90% for 3 consecutive datapoints) notifies via SNS and can scale out via Auto Scaling. Configure missing-data treatment to avoid false alarms during gaps.
Q. Memory/disk missing? The agent isn’t installed—add the CloudWatch agent. Q. What is INSUFFICIENT_DATA? A not-enough-data state (not necessarily a fault). Q. Want 1-minute? Enable detailed monitoring. Q. Auto-add capacity on high CPU? Alarm → Auto Scaling action.
Watch the mix-ups: (1) Memory/disk aren’t collected by default (agent required)—the most common SOA trap. (2) INSUFFICIENT_DATA means lacking data, not a fault. (3) Detailed monitoring (1-min) costs extra. (4) The EC2 "recover" action restores the same instance on another host after hardware failure.
1.1.2Section summary
- Alarm = three states from threshold + period; actions on state change
- Memory/disk need the agent
Sign in to track progress — Log in.
Quick check
(just a quick review)Q1. You want to monitor EC2 memory usage in CloudWatch. What is required?
Q2. Which is the correct set of CloudWatch alarm states?
Q3. You want to add EC2 instances automatically on high CPU. Which action fits from an alarm?
Keep track of your progress
The full study guide is free to read. Sign up free to practice with the question bank, track what you have read, review your mistakes, and highlight passages.