

What's changed: Deepened SOA-C02 Chapter 1 to Associate depth (tables, scenarios, FAQ, traps; localized figures)
1.2Log Aggregation and Audit (CloudWatch Logs and CloudTrail)
Understand aggregating app/OS logs with CloudWatch Logs and Logs Insights, auditing API activity (who did what) with CloudTrail, and when to use each.
Logs are essential for investigation and audit. On AWS, app/OS logs = CloudWatch Logs, while API activity records = CloudTrail.
1.2.1Logs and audit trail
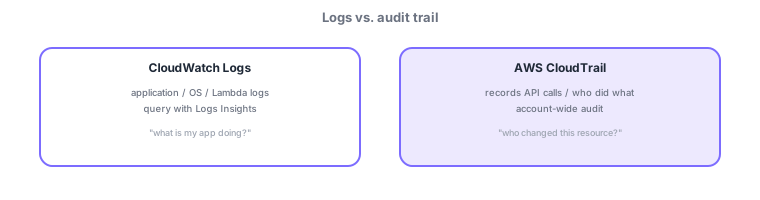
- CloudWatch Logs: aggregates app/OS/Lambda logs; query/analyze with Logs Insights.
- Metric filter: turns log pattern occurrences (e.g., ERROR) into a metric you can alarm on.
- CloudTrail: records API activity (who, when, what) for account-wide auditing.
Common on SOA: who changed/deleted a resource = CloudTrail, investigate app/OS logs = CloudWatch Logs, alarm on a word’s occurrence in logs = metric filter + alarm. Don’t confuse them.
Separate them by role. CloudWatch Logs aggregates logs to see "what apps/OS are doing," organized into log groups / log streams and analyzed across with the Logs Insights query language. Counting occurrences of a pattern like "ERROR" via a metric filter turns it into a metric you can alarm on (prior section). CloudTrail, by contrast, is the audit service recording "who called which API and when," letting you trace resource create/change/delete. Use an organization trail to aggregate all accounts and Regions into one place, store long-term in S3, and enable log file validation for tamper detection. Data events (S3 object operations, Lambda invokes) are off by default—enable them explicitly when needed. To ship EC2/on-prem logs to Logs, use the CloudWatch agent (or the unified agent).
| What you want | Use |
|---|---|
| What the app/OS is doing | CloudWatch Logs (Logs Insights) |
| Who changed/deleted a resource | CloudTrail |
| Alarm on a word in logs | Metric filter + alarm |
| Audit all accounts/Regions | CloudTrail org trail → S3 |
Scenario: someone changed a production security group. Identify "who/when/what" via CloudTrail (org trail spans all accounts). Investigate app impact in CloudWatch Logs with Logs Insights for the time window. To prevent recurrence, watch that API with a metric filter + alarm notifying SNS, and wire EventBridge to auto-remediate.
Q. Who deleted it? CloudTrail. Q. Analyze app error logs? CloudWatch Logs (Logs Insights). Q. Record S3 object reads? Enable CloudTrail data events. Q. Detect log tampering? Log file validation.
Watch the mix-ups: (1) CloudTrail = API audit (who did what) / CloudWatch Logs = app/OS logs (what happened)—don’t swap roles. (2) Data events (S3/Lambda) are off by default. (3) CloudTrail shows management events in Event history for 90 days, but long-term retention needs an S3 trail.
Storing a CloudTrail trail in S3 long-term and aggregating multi-region/org-wide into one place aids audit and compliance.
1.2.2Section summary
- CloudWatch Logs = app/OS logs / CloudTrail = API activity audit
- Alarm on log words = metric filter + alarm
Sign in to track progress — Log in.
Quick check
(just a quick review)Q1. You want to investigate "who deleted that resource and when." Which service fits best?
Q2. You want to aggregate app logs and analyze them with a query language. What do you use?
Q3. You want to notify when "ERROR" appears more than N times in logs. What do you use?