

What's changed: Initial version
4.1Diagnostic tools (debug, ping, traceroute, SNMP, syslog)
Covers debug and the CPU-friendly conditional debug, ping for L3 reachability (extended ping with source/size/df-bit), traceroute for seeing where a path stops, SNMP for collecting device state by polling and notification, and syslog with severity design--all framed as the isolation judgment of "which tool confirms what, without overloading a production device."
Network assurance is not the art of investigating after a break; it is the art of continuously measuring the normal state so that, when something goes wrong, you can pin down the layer and location fastest. What this ENCOR area really tests is not the names of tools but the order in which you reach for them. Firing debug ip packet on a production core router can saturate the CPU and create a second outage. Start with zero-cost show commands and the syslog you are already collecting, then isolate reachability with ping/traceroute, and only then move to a tightly scoped debug. That order is the backbone of the right answer both in the field and on the exam.
4.1.1debug and conditional debug
debugprints a process's internal handling in real time, which forces process switching and spikes CPU utilization. Broad debugs such asdebug ip packetare effectively forbidden on production devices; the standard practice is to narrow the hypothesis first with zero-loadshowcommands such asshow ip ospf neighbor,show interfaces, andshow logging. Check what is enabled withshow debuggingand stop it definitively withundebug all(=no debug all).- Conditional debug: setting a condition first--for example
debug condition interface GigabitEthernet0/1--and then enablingdebugrestricts output to what matches that interface (or filters such asdebug condition ip), which dramatically reduces both CPU load and output volume. Review conditions withshow debug conditionand clear them withno debug condition allrather thanundebug all(a leftover condition silently narrows the next debug). - By default debug output goes only to the console. Viewing it over an SSH/Telnet vty requires
terminal monitor, and if you want to re-read it later it is safer to send it to the buffer with something likelogging buffered 8192 debuggingand collect it withshow logging(console output can slow the whole device when the console is slow). To correlate timestamps, first setservice timestamps debug datetime msecand ensure NTP synchronization.
4.1.2Isolating reachability with ping and traceroute
- A plain
pingsources from the outgoing interface address, so it cannot reproduce the case where "it works from the router but not from users." An extended ping such asping 10.20.0.10 source Loopback0uses the same source as real traffic, exposing asymmetry in the return route or in ACLs. Combiningsizeanddf-bit--ping 10.20.0.10 size 1500 df-bit--is effective for path MTU discovery: the smallest failing size reveals the bottleneck MTU. traceroutesends probes with TTL incremented by one and maps the path from the ICMP time-exceeded messages each hop returns (IOS uses UDP probes by default; the Windowstracertuses ICMP echo). The point of the isolation is from which hop onward the responses change, and you should align the source as well:traceroute 10.20.0.10 source Loopback0.- A
* * *at an intermediate hop does not necessarily mean a broken path. Many devices rate-limit ICMP or suppress time-exceeded by policy, so even with silent middle hops, if the final hop replies then forwarding itself is succeeding. Conversely, if the trace never reaches the final line and everything past a given hop is silent, suspect beyond that hop. Codes such as!H(host unreachable) and!A(administratively prohibited, i.e. an ACL drop) are strong hints that name the cause directly.
4.1.3SNMP and syslog (designing severity)
- SNMP has the management station (NMS) poll values per OID (get/getnext/getbulk over UDP 161), while the device notifies with a trap (fire and forget) or an inform (acknowledged and retransmitted) over UDP 162. v2c carries the community string in clear text, so operational deployments choose v3 (
authPriv, i.e. authentication plus encryption). The judgment point: when a notification must not be lost, choose an inform rather than a trap. - For syslog, severity 0 is the most severe: 0 emergencies / 1 alerts / 2 critical / 3 errors / 4 warnings / 5 notifications / 6 informational / 7 debugging.
logging trap 4sends only messages at level 4 or below (numerically equal or smaller, i.e. more severe) to the server, so%LINK-3-UPDOWN(level 3) is sent but debug output (level 7) is not. That asymmetry is a classic pitfall both in the field and on the exam. - Design destinations and granularity independently:
logging host 10.50.0.9(destination),logging trap <level>(to the server),logging buffered <size> <level>(local buffer), andlogging console <level>(console). Leavinglogging console debuggingin place lets console writes choke the device, so production practice is to restrict it to aboutlogging console criticaland take the detail through the buffer and the server.show loggingshows the current destinations and levels.
Most-tested: scope a production debug first with debug condition interface and friends; clear conditions with no debug condition all; use extended ping source to reproduce the real traffic source and size plus df-bit for path MTU discovery; a * * * mid-trace does not necessarily mean a break (ICMP rate limiting/suppression); syslog severity 0 is most severe and 7 is debugging; logging trap 4 does not forward debug (7); an SNMP trap is unacknowledged while an inform is acknowledged, and v2c is clear text while v3 offers authPriv. Remember it as an ordering of tools (show -> syslog -> ping/traceroute -> scoped debug) and the questions fall out.
On a head-office distribution switch, the OSPF adjacency with a branch WAN router flaps just a few times a day, each time causing tens of seconds of outage. CPU utilization sits at 55-65% even when healthy, so enabling debug ip ospf adj unconditionally would stream output for all twelve adjacencies and push the CPU higher--running it as-is is not an option. Starting with show logging, you see sporadic %OSPF-5-ADJCHG and, just before each one, not %LINK-3-UPDOWN but %OSPF-4-ERRRCV, which points to an OSPF packet reception problem rather than a physical failure. The correct move here is to restrict the scope to the single interface carrying the troubled adjacency: configure debug condition interface GigabitEthernet0/1, then enable debug ip ospf adj, and send the output to logging buffered 16384 debugging rather than the console so you can collect it with show logging. In parallel, if ping 10.10.0.2 source Vlan10 size 1500 df-bit fails while size 1476 succeeds, you have confirmed a tunnel segment with MTU 1476 along the path, and the hypothesis that OSPF DBD exchange stalls on large packets and flaps the adjacency becomes strongly favored. By contrast, concluding "the path is broken" because intermediate traceroute hops showed * * * would be wrong: since the final hop replies, forwarding is working, and you are merely observing ICMP rate limiting on transit devices. It is also risky to finish the investigation with undebug all alone--without no debug condition all the condition persists, and the next time you enable a debug for a different fault you get the secondary confusion of "nothing is printing." More than the tools themselves, the order in which you eliminate hypotheses without raising load determines the quality of the diagnosis.
| Tool | What it confirms | Load / risk | When to use |
|---|---|---|---|
| `show` commands / `show logging` | Current state and past events (adjacency, interfaces, errors) | Essentially zero | The first move; narrow the hypothesis |
| `ping` (extended) | L3 reachability, return path, path MTU (`size` + `df-bit`) | Low | Source-dependent symptoms or suspected MTU issues |
| `traceroute` | From which hop onward behavior changes | Low | Localize along the path (`* * *` is not proof of a break) |
| SNMP (polling / trap / inform) | Continuous state values and fault notifications | Low (depends on poll interval) | Continuous monitoring; use inform when loss is unacceptable |
| `debug` (conditional) | Detailed internal process behavior | High (unconditional use is dangerous in production) | Last resort when nothing else confirms; always scope it |
Trap: "With logging trap 4, debug output also reaches the syslog server" is wrong--debug is severity 7 (debugging), which is less severe than level 4 and therefore excluded. To forward it you need logging trap debugging (7). Also wrong: "* * * mid-traceroute means the path is broken"--that is merely ICMP rate limiting or suppression, and forwarding is fine as long as the final hop replies. Wrong again: "undebug all alone restores everything"--conditions persist unless you explicitly clear them with no debug condition all, leaving your next debug silent.
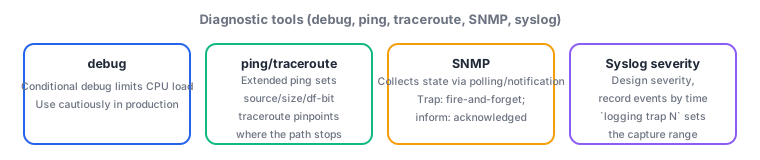
4.1.4Section summary
- Work from the lowest load upward:
show/show logging->ping/traceroute-> a scopeddebug. An unconditionaldebugon a production device saturates the CPU and creates a second outage - Conditional debug sets the condition first with
debug condition interface ...and is cleared withno debug condition all. Extended ping reproduces real traffic withsource, andsizeplusdf-bitpinpoints path MTU - Syslog severity runs from 0 (emergencies, most severe) to 7 (debugging, least), and
logging trap Nforwards only level N or below (more severe). In SNMP, a trap is unacknowledged while an inform is acknowledged, and since v2c is clear text you choose v3 (authPriv)
Sign in to track progress — Log in.
Quick check
(just a quick review)Q1. On a production distribution switch (CPU around 60% even when healthy, twelve OSPF adjacencies), only one adjacency flaps a few times a day. You want detailed OSPF processing, but must avoid affecting the other adjacencies and saturating the CPU. Which procedure is most appropriate?
Q2. A device configured with `logging host 10.50.0.9` and `logging trap 4` records interface UP/DOWN events (`%LINK-3-UPDOWN`) on the server, but the output of an enabled debug never appears there. Which explanation best fits?
Q3. Users report that "only large file transfers from headquarters to the branch server stall midway." From the router, `ping 10.20.0.10` succeeds, `ping 10.20.0.10 source Vlan10 size 1500 df-bit` fails, and `size 1476 df-bit` succeeds. A traceroute shows `* * *` at two intermediate hops but the final hop replies. What is the most appropriate conclusion?
Keep track of your progress
The full study guide is free to read. Sign up free to practice with the question bank, track what you have read, review your mistakes, and highlight passages.